回测图表Backtest Charts
点击图片可放大查看Click to enlarge
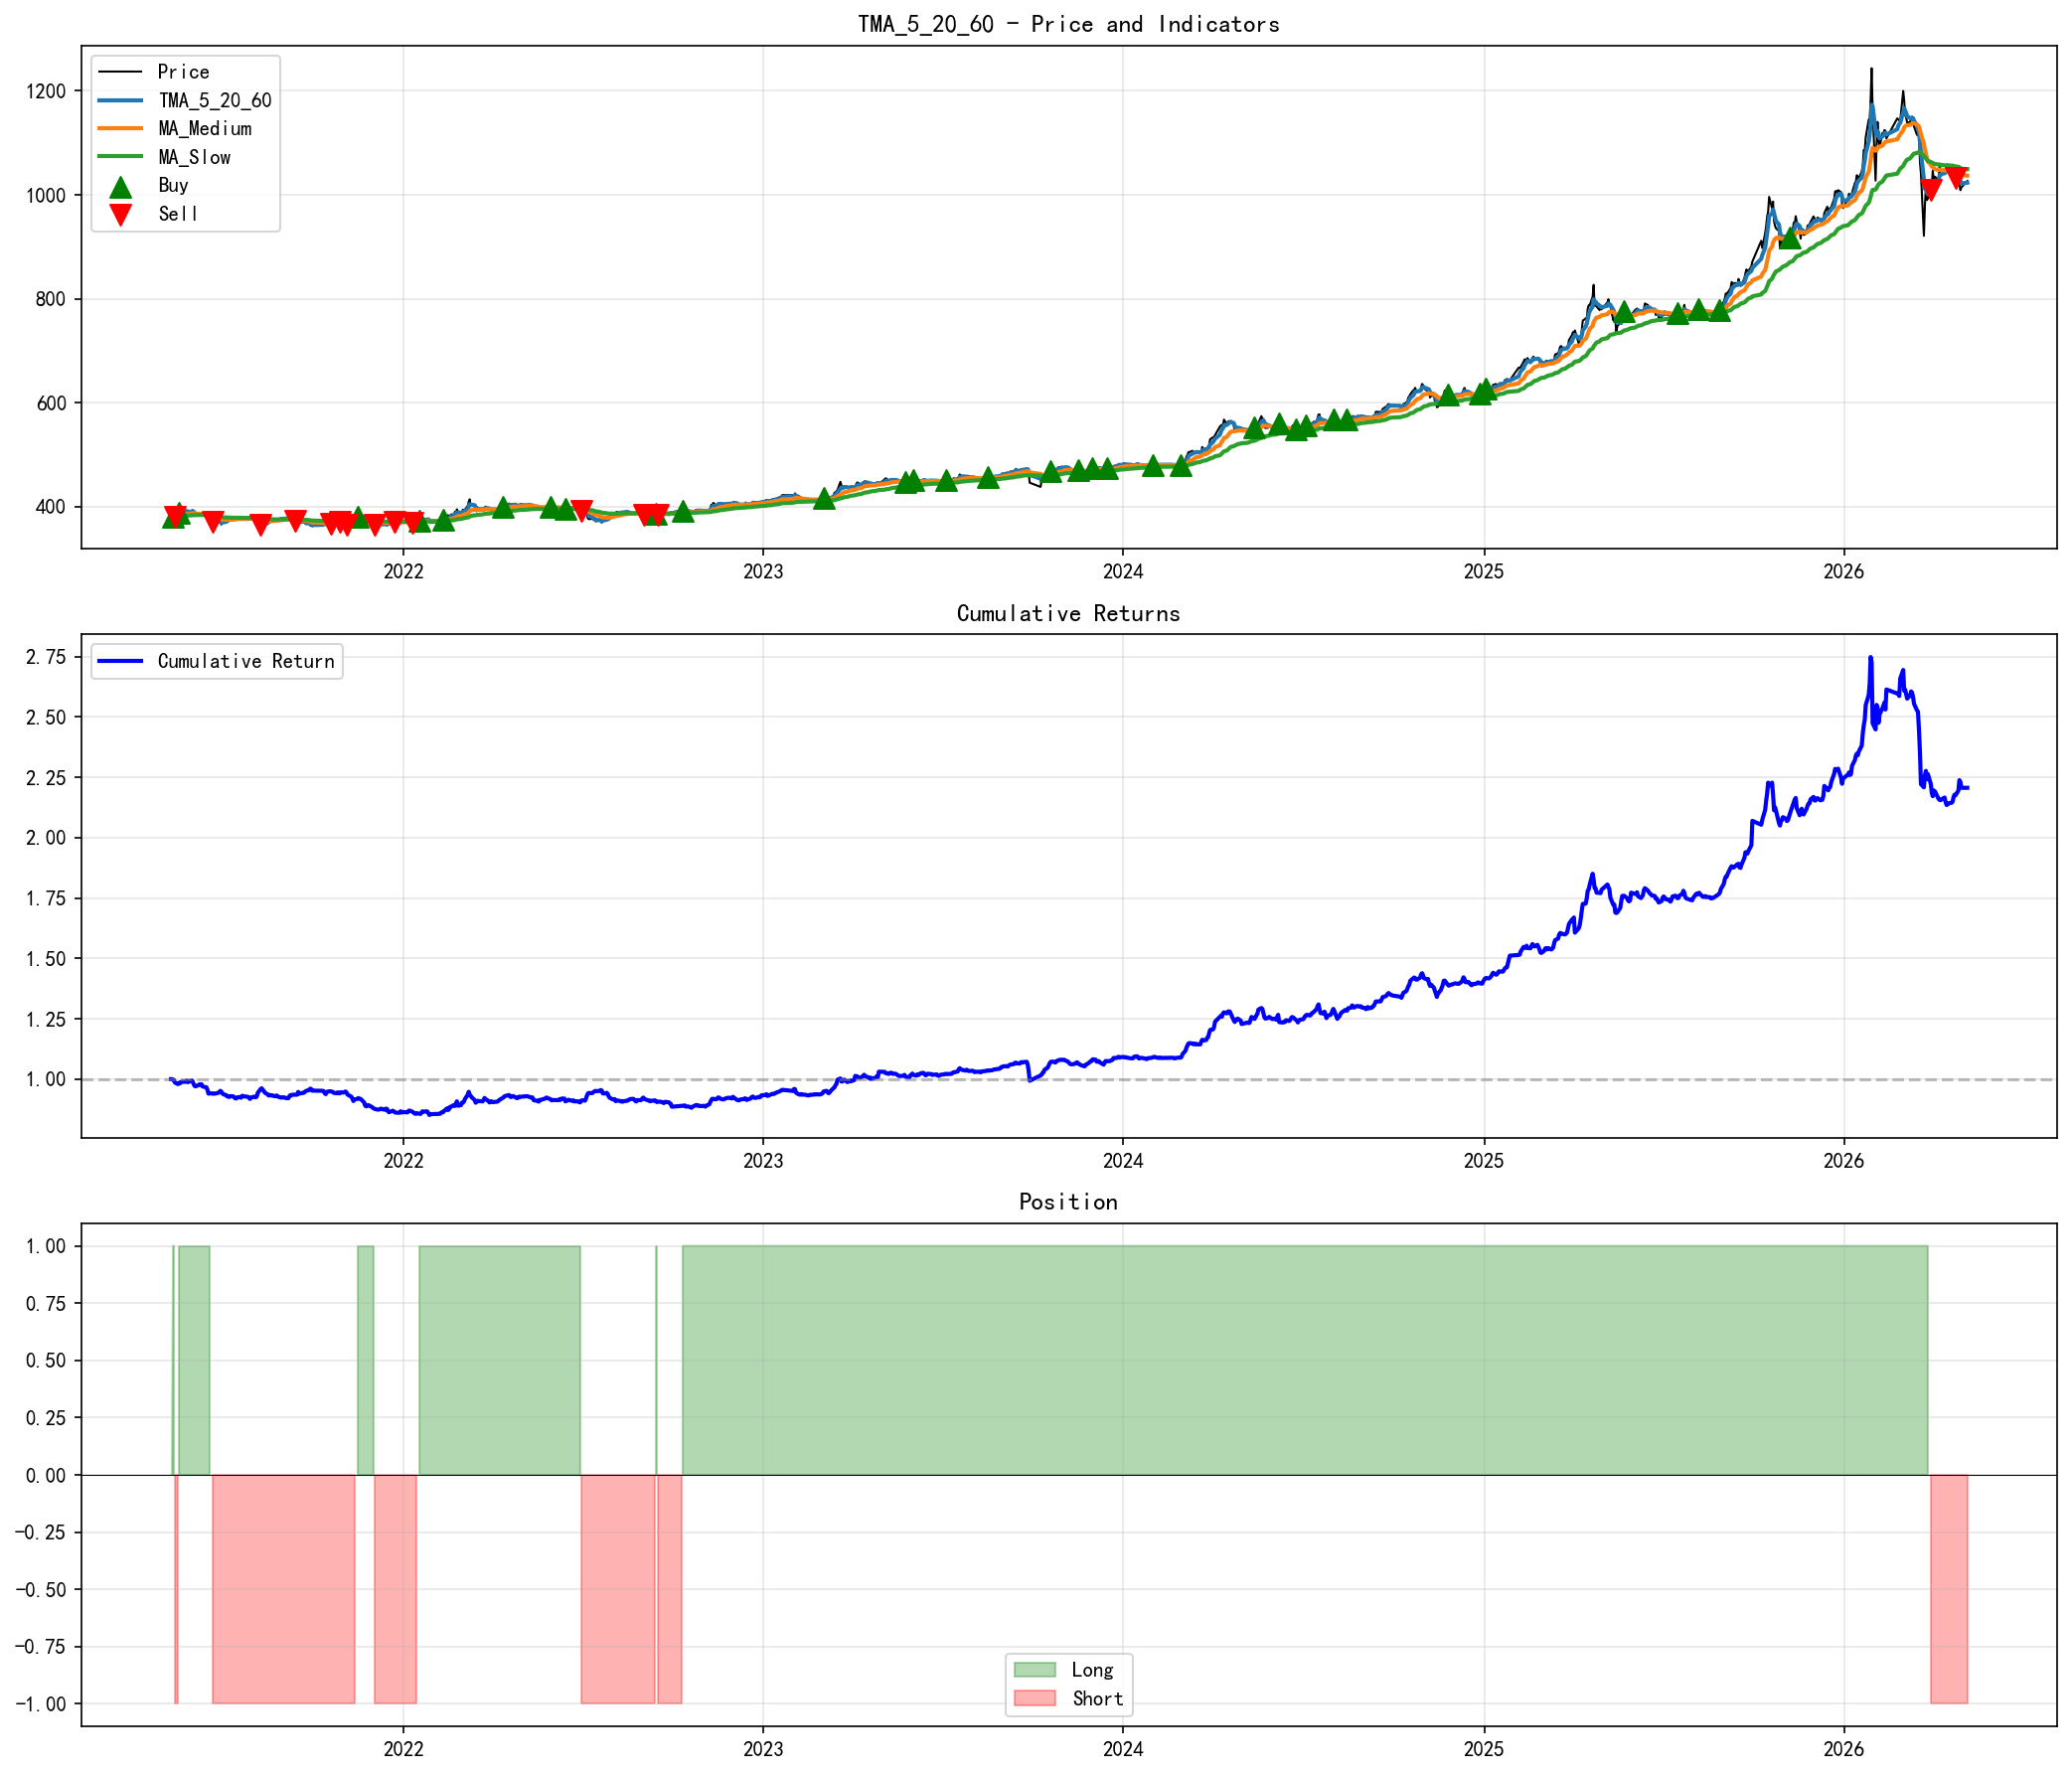
TMA (5/20/60) — 累积收益 120.66%Cumulative Return 120.66%
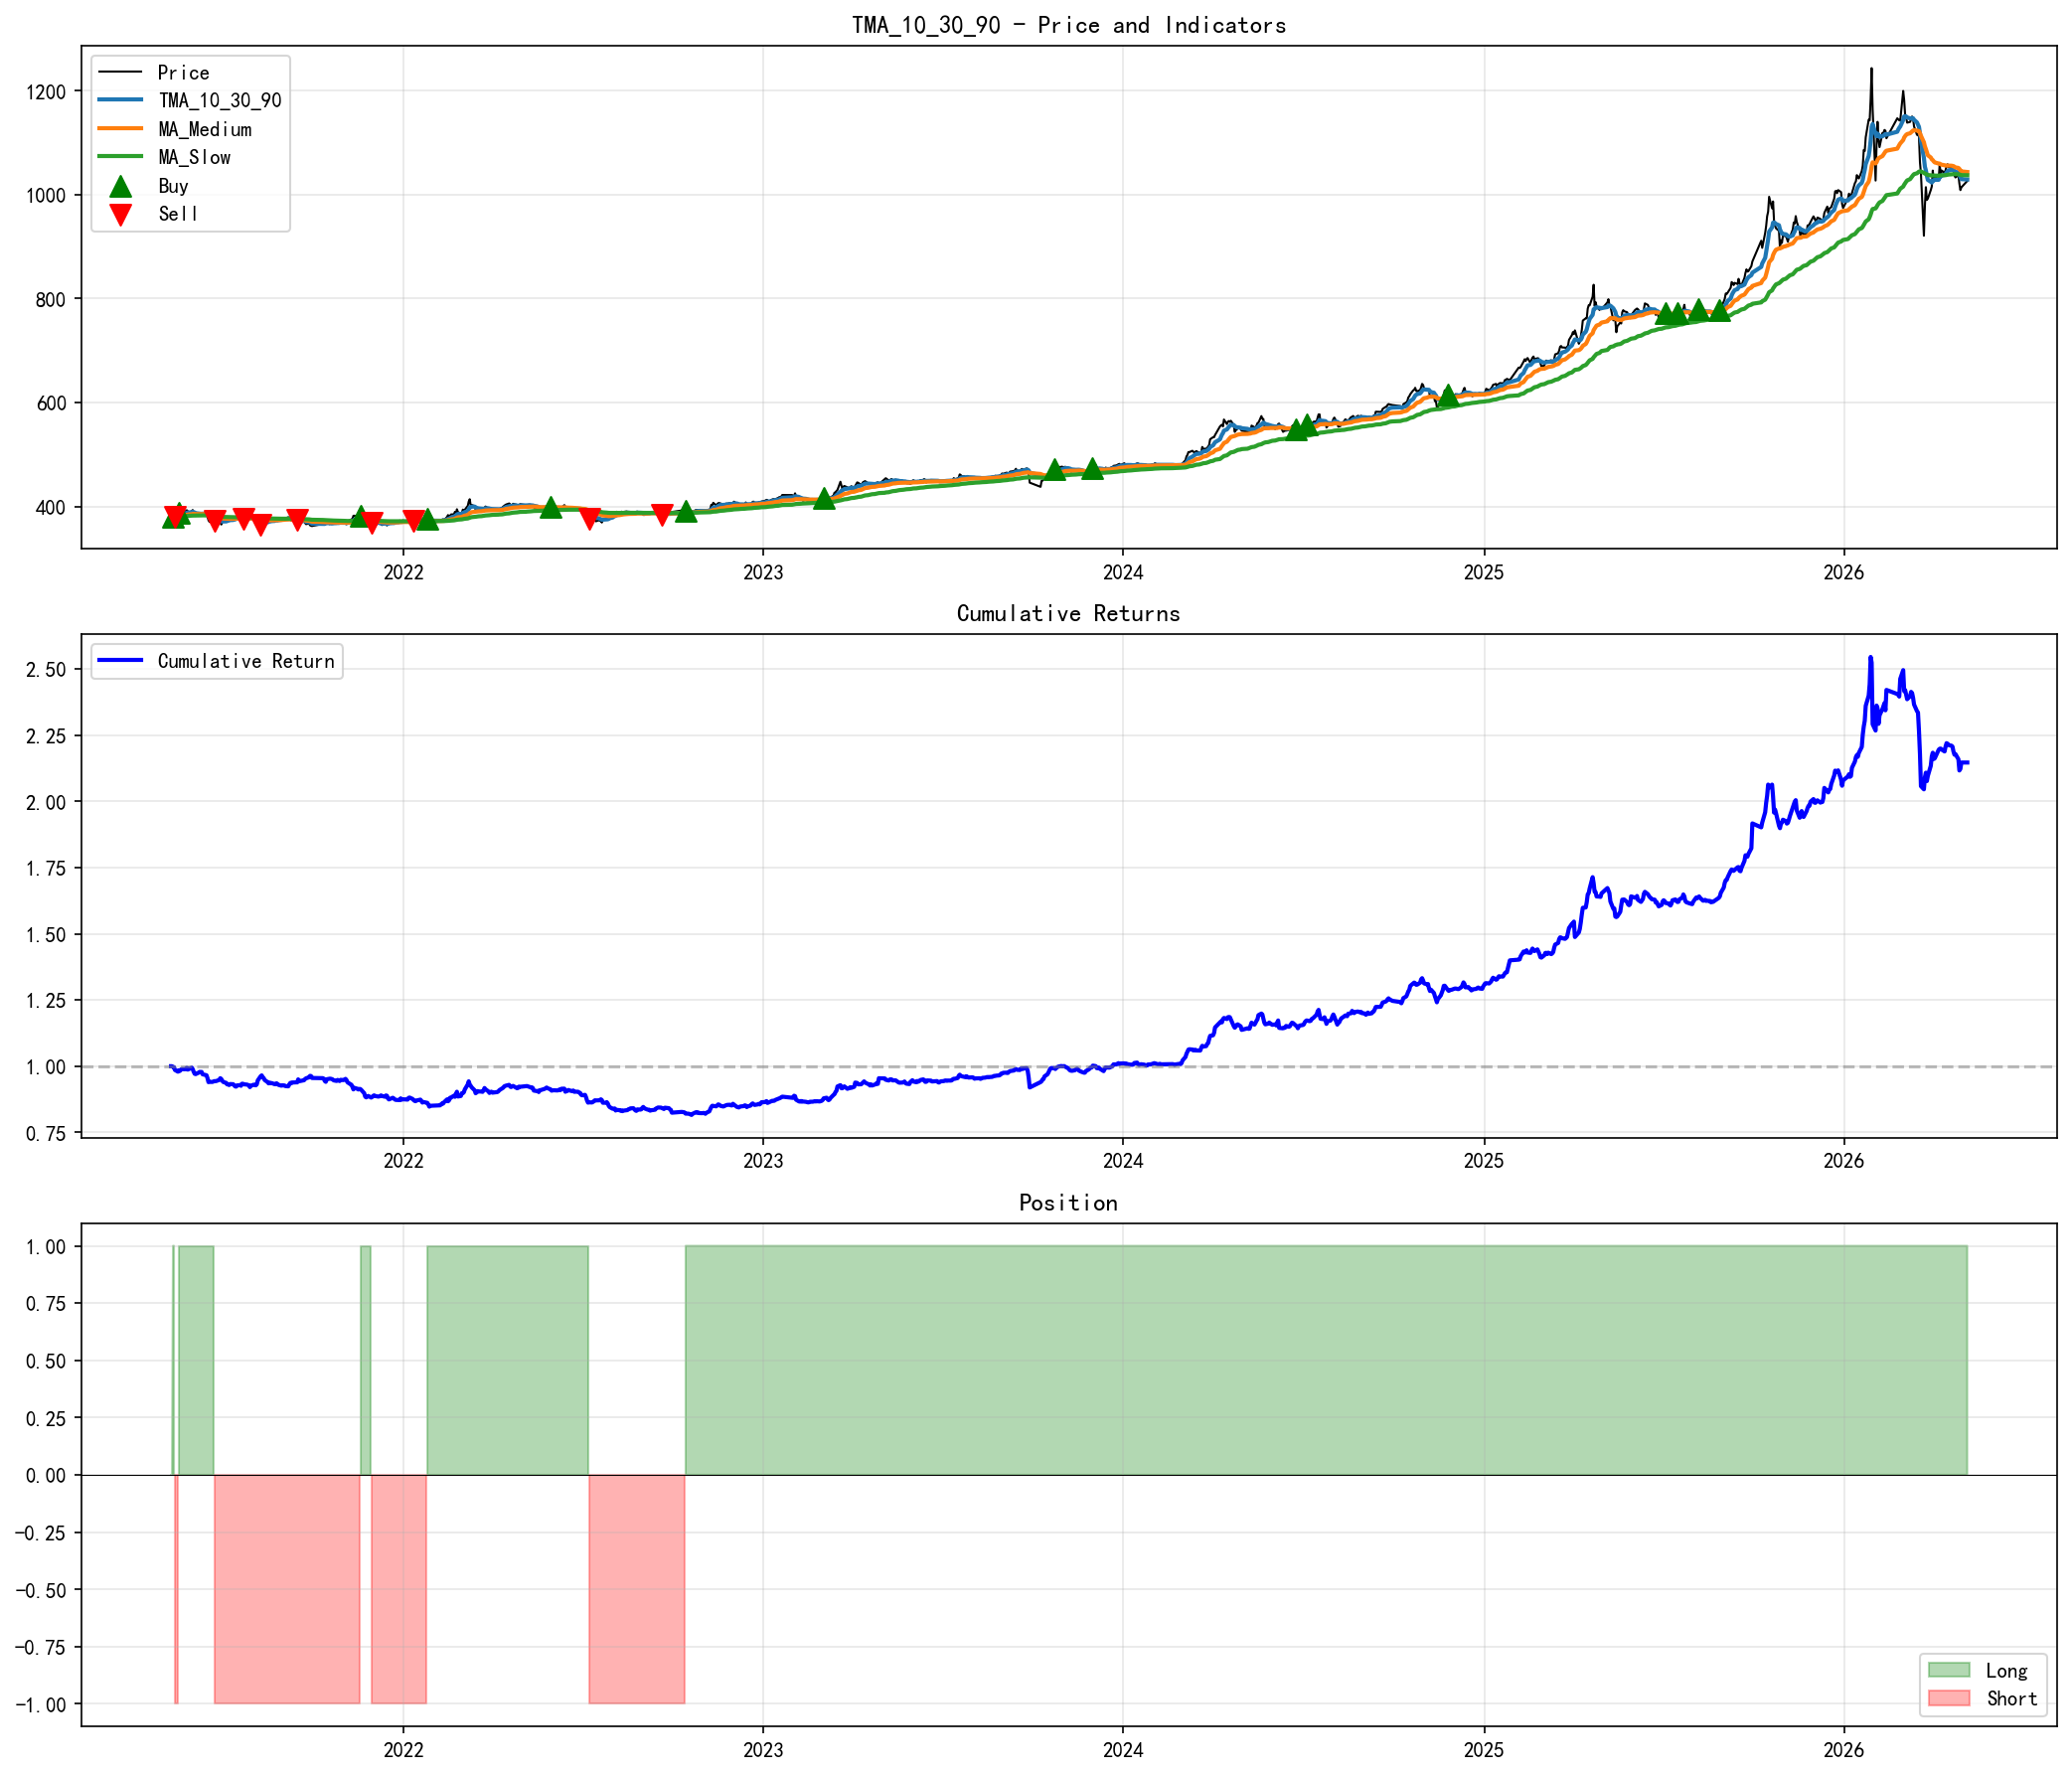
TMA (10/30/90) — 累积收益 114.63%Cumulative Return 114.63%
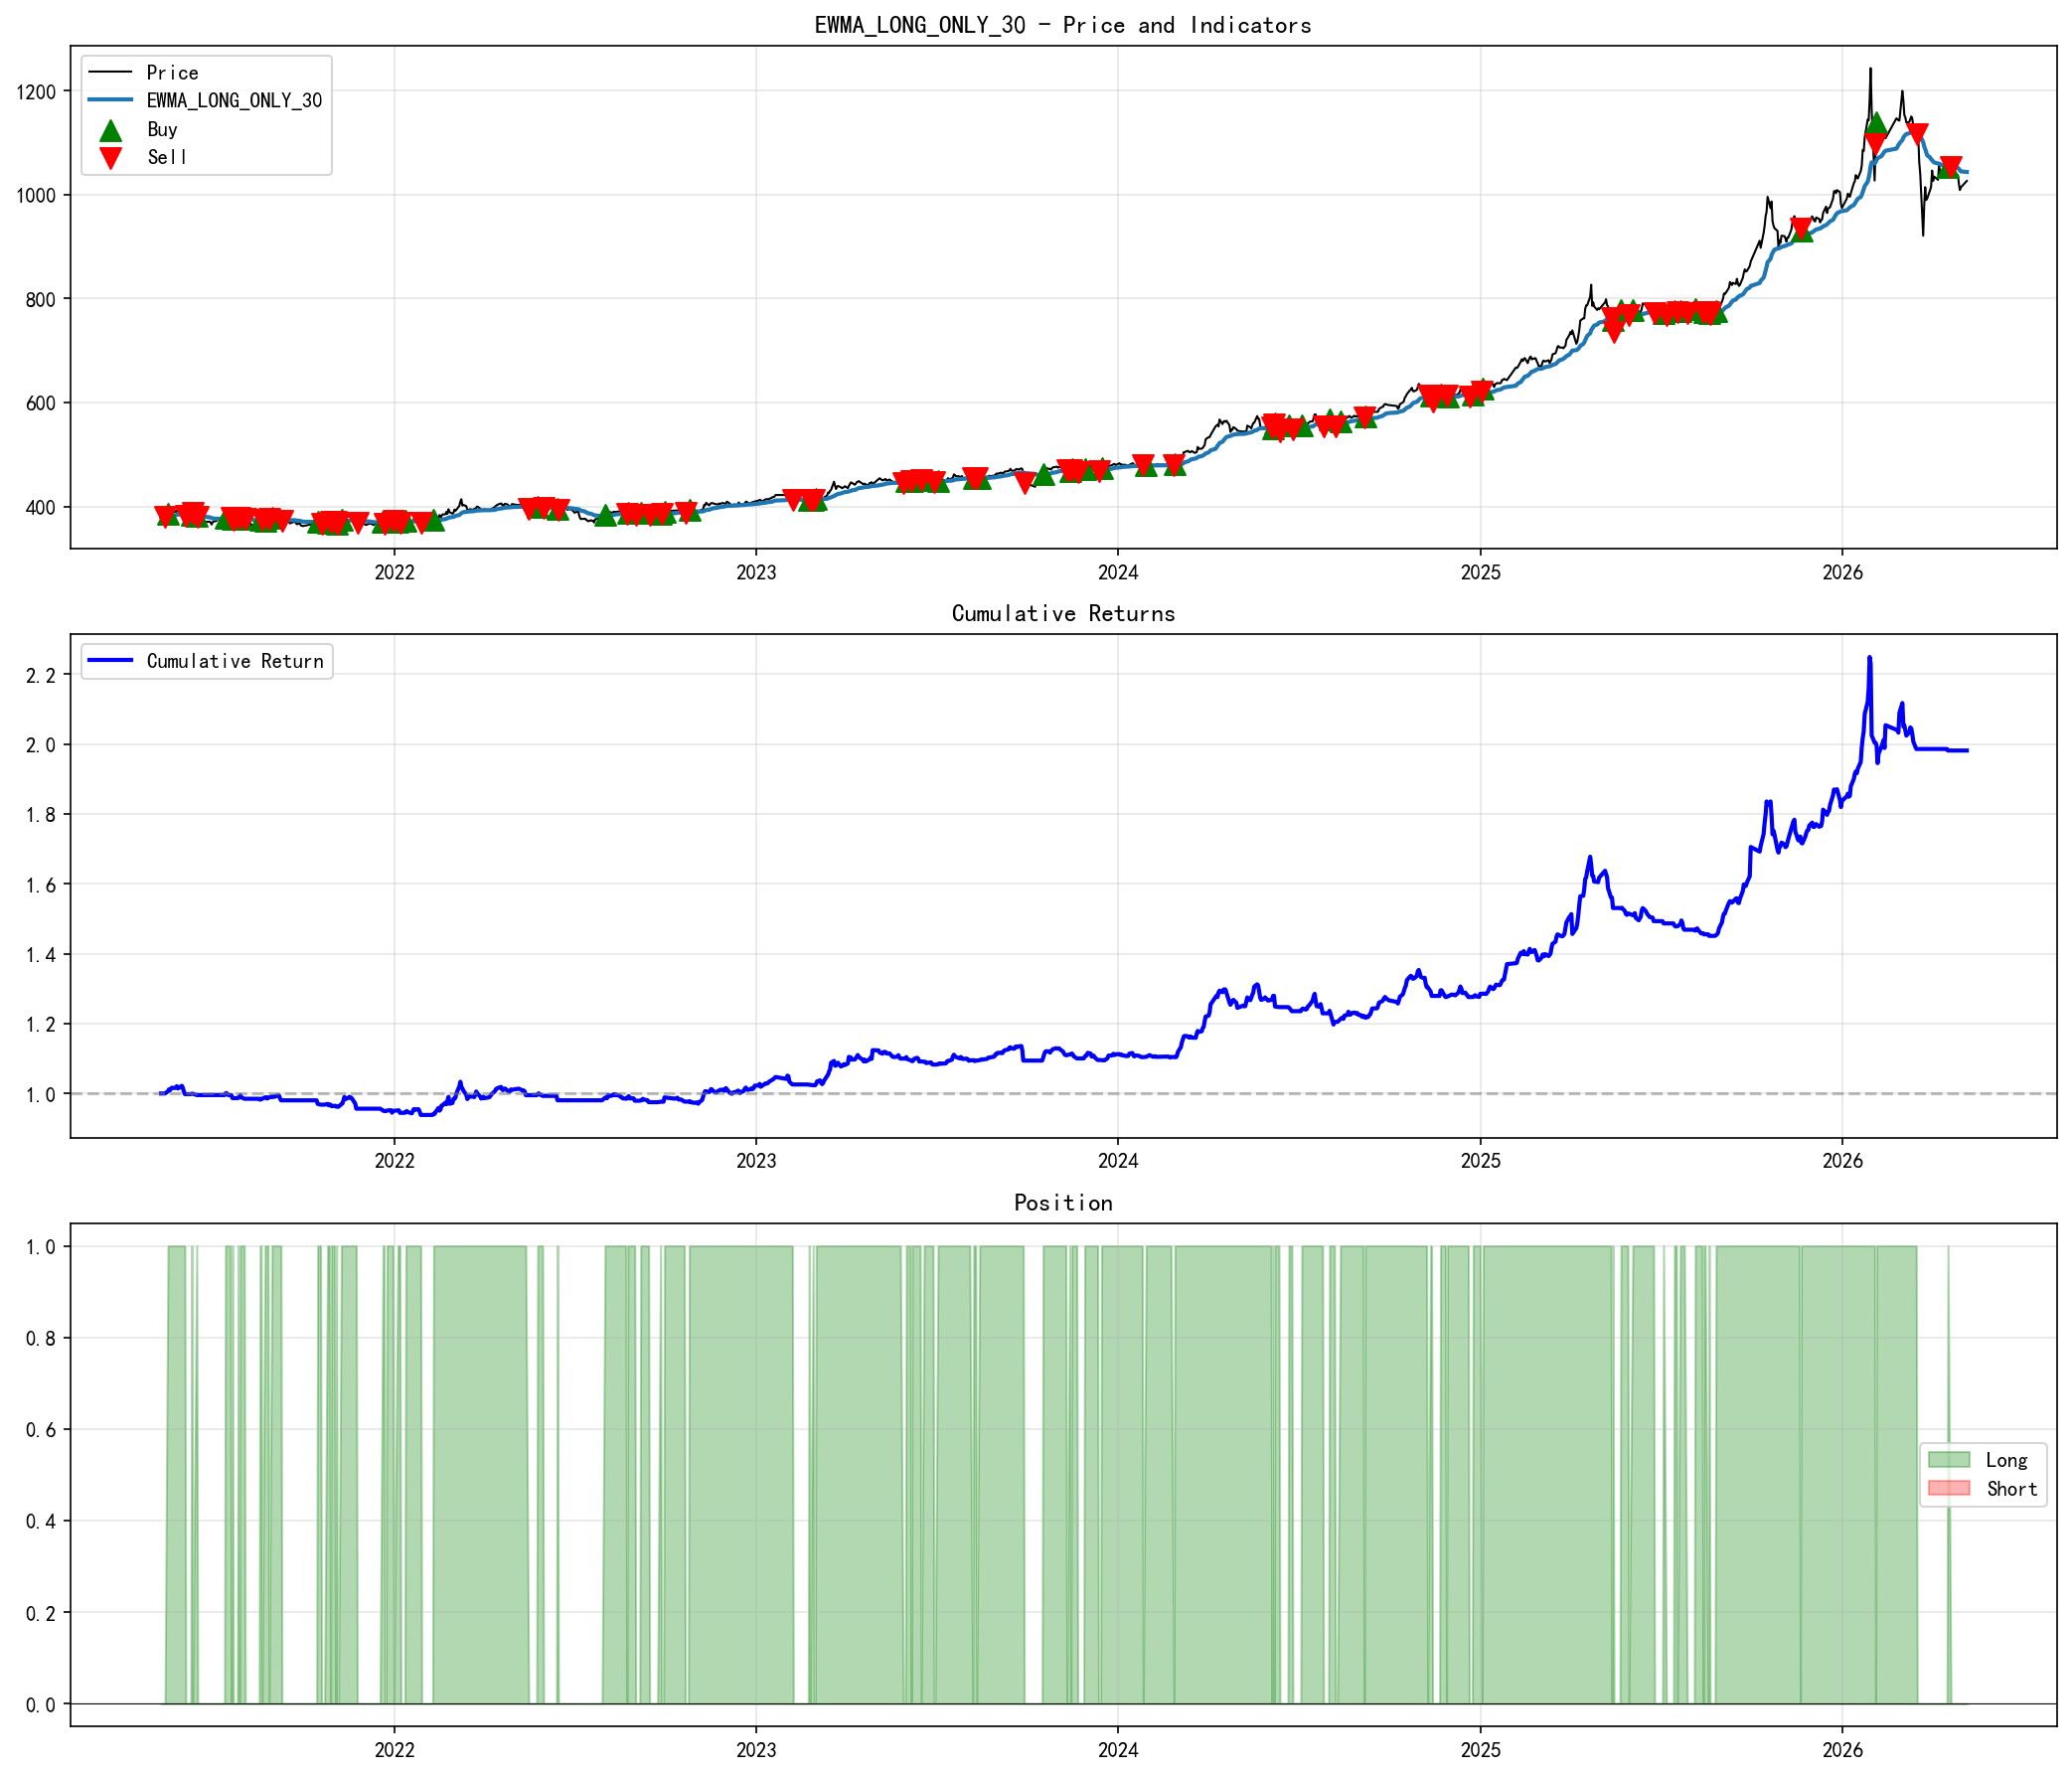
EWMA Long-Only — 累积收益 98.13%Cumulative Return 98.13%
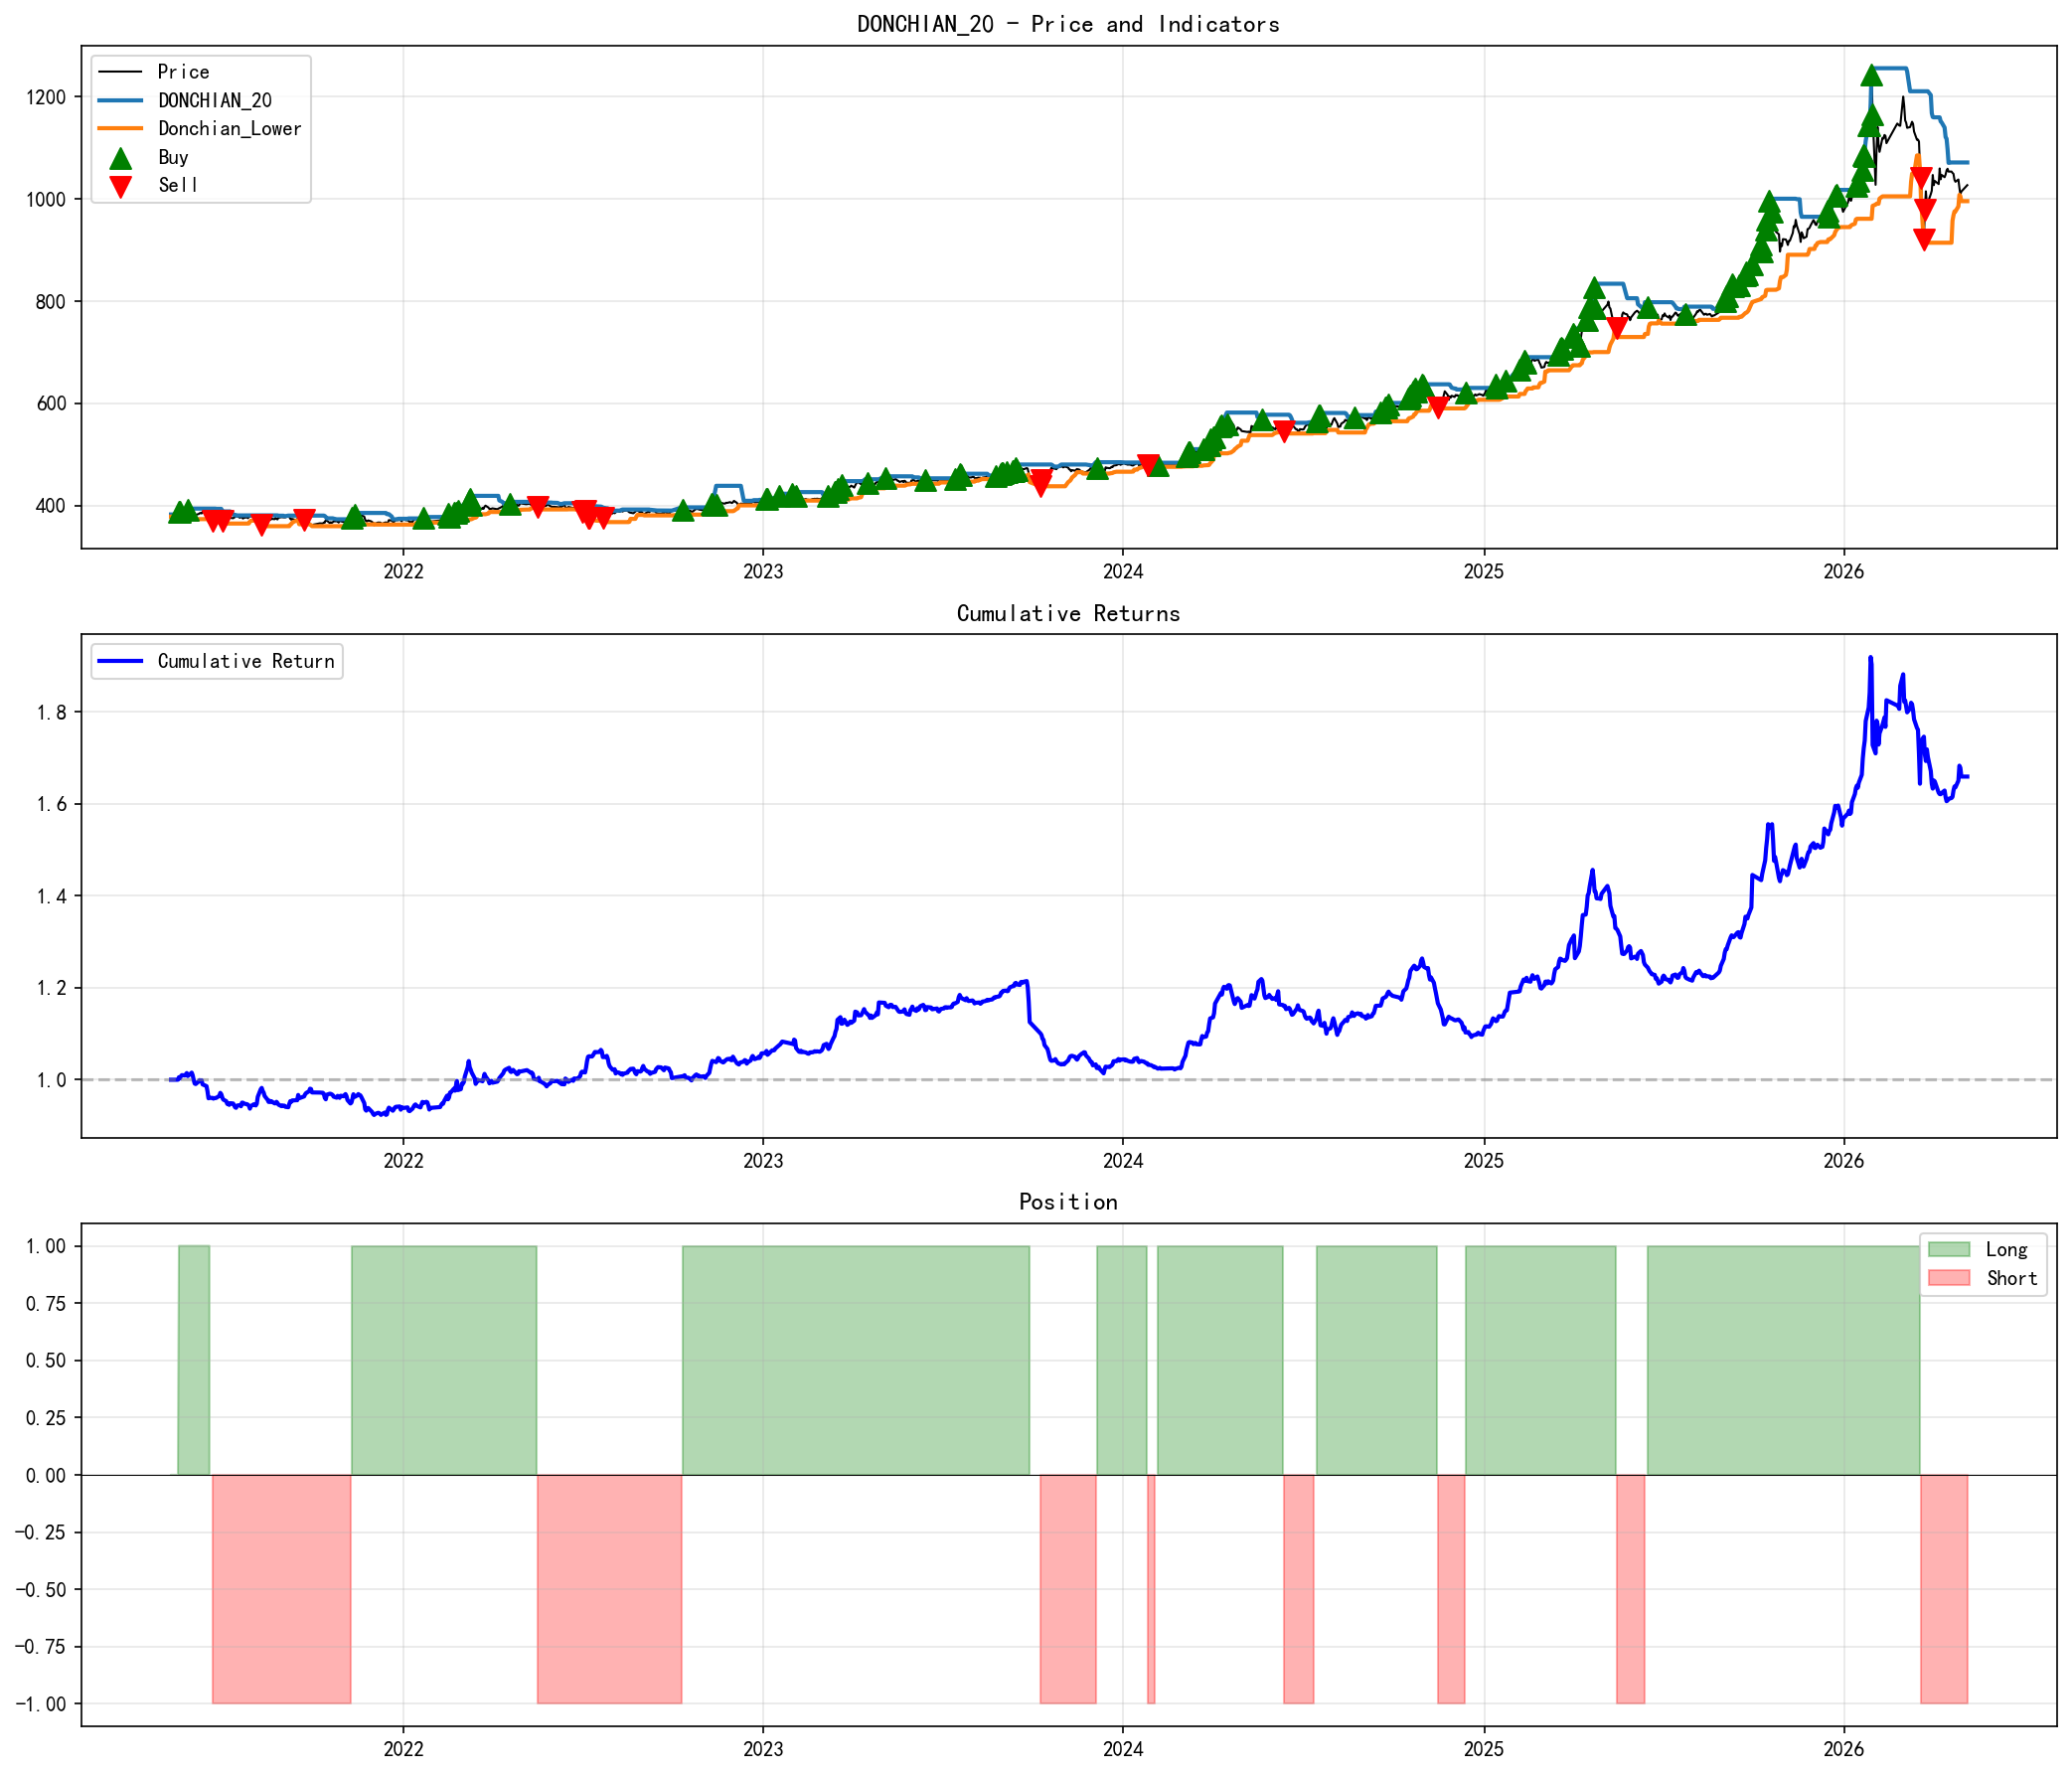
Donchian (20) — 累积收益 65.89%Cumulative Return 65.89%
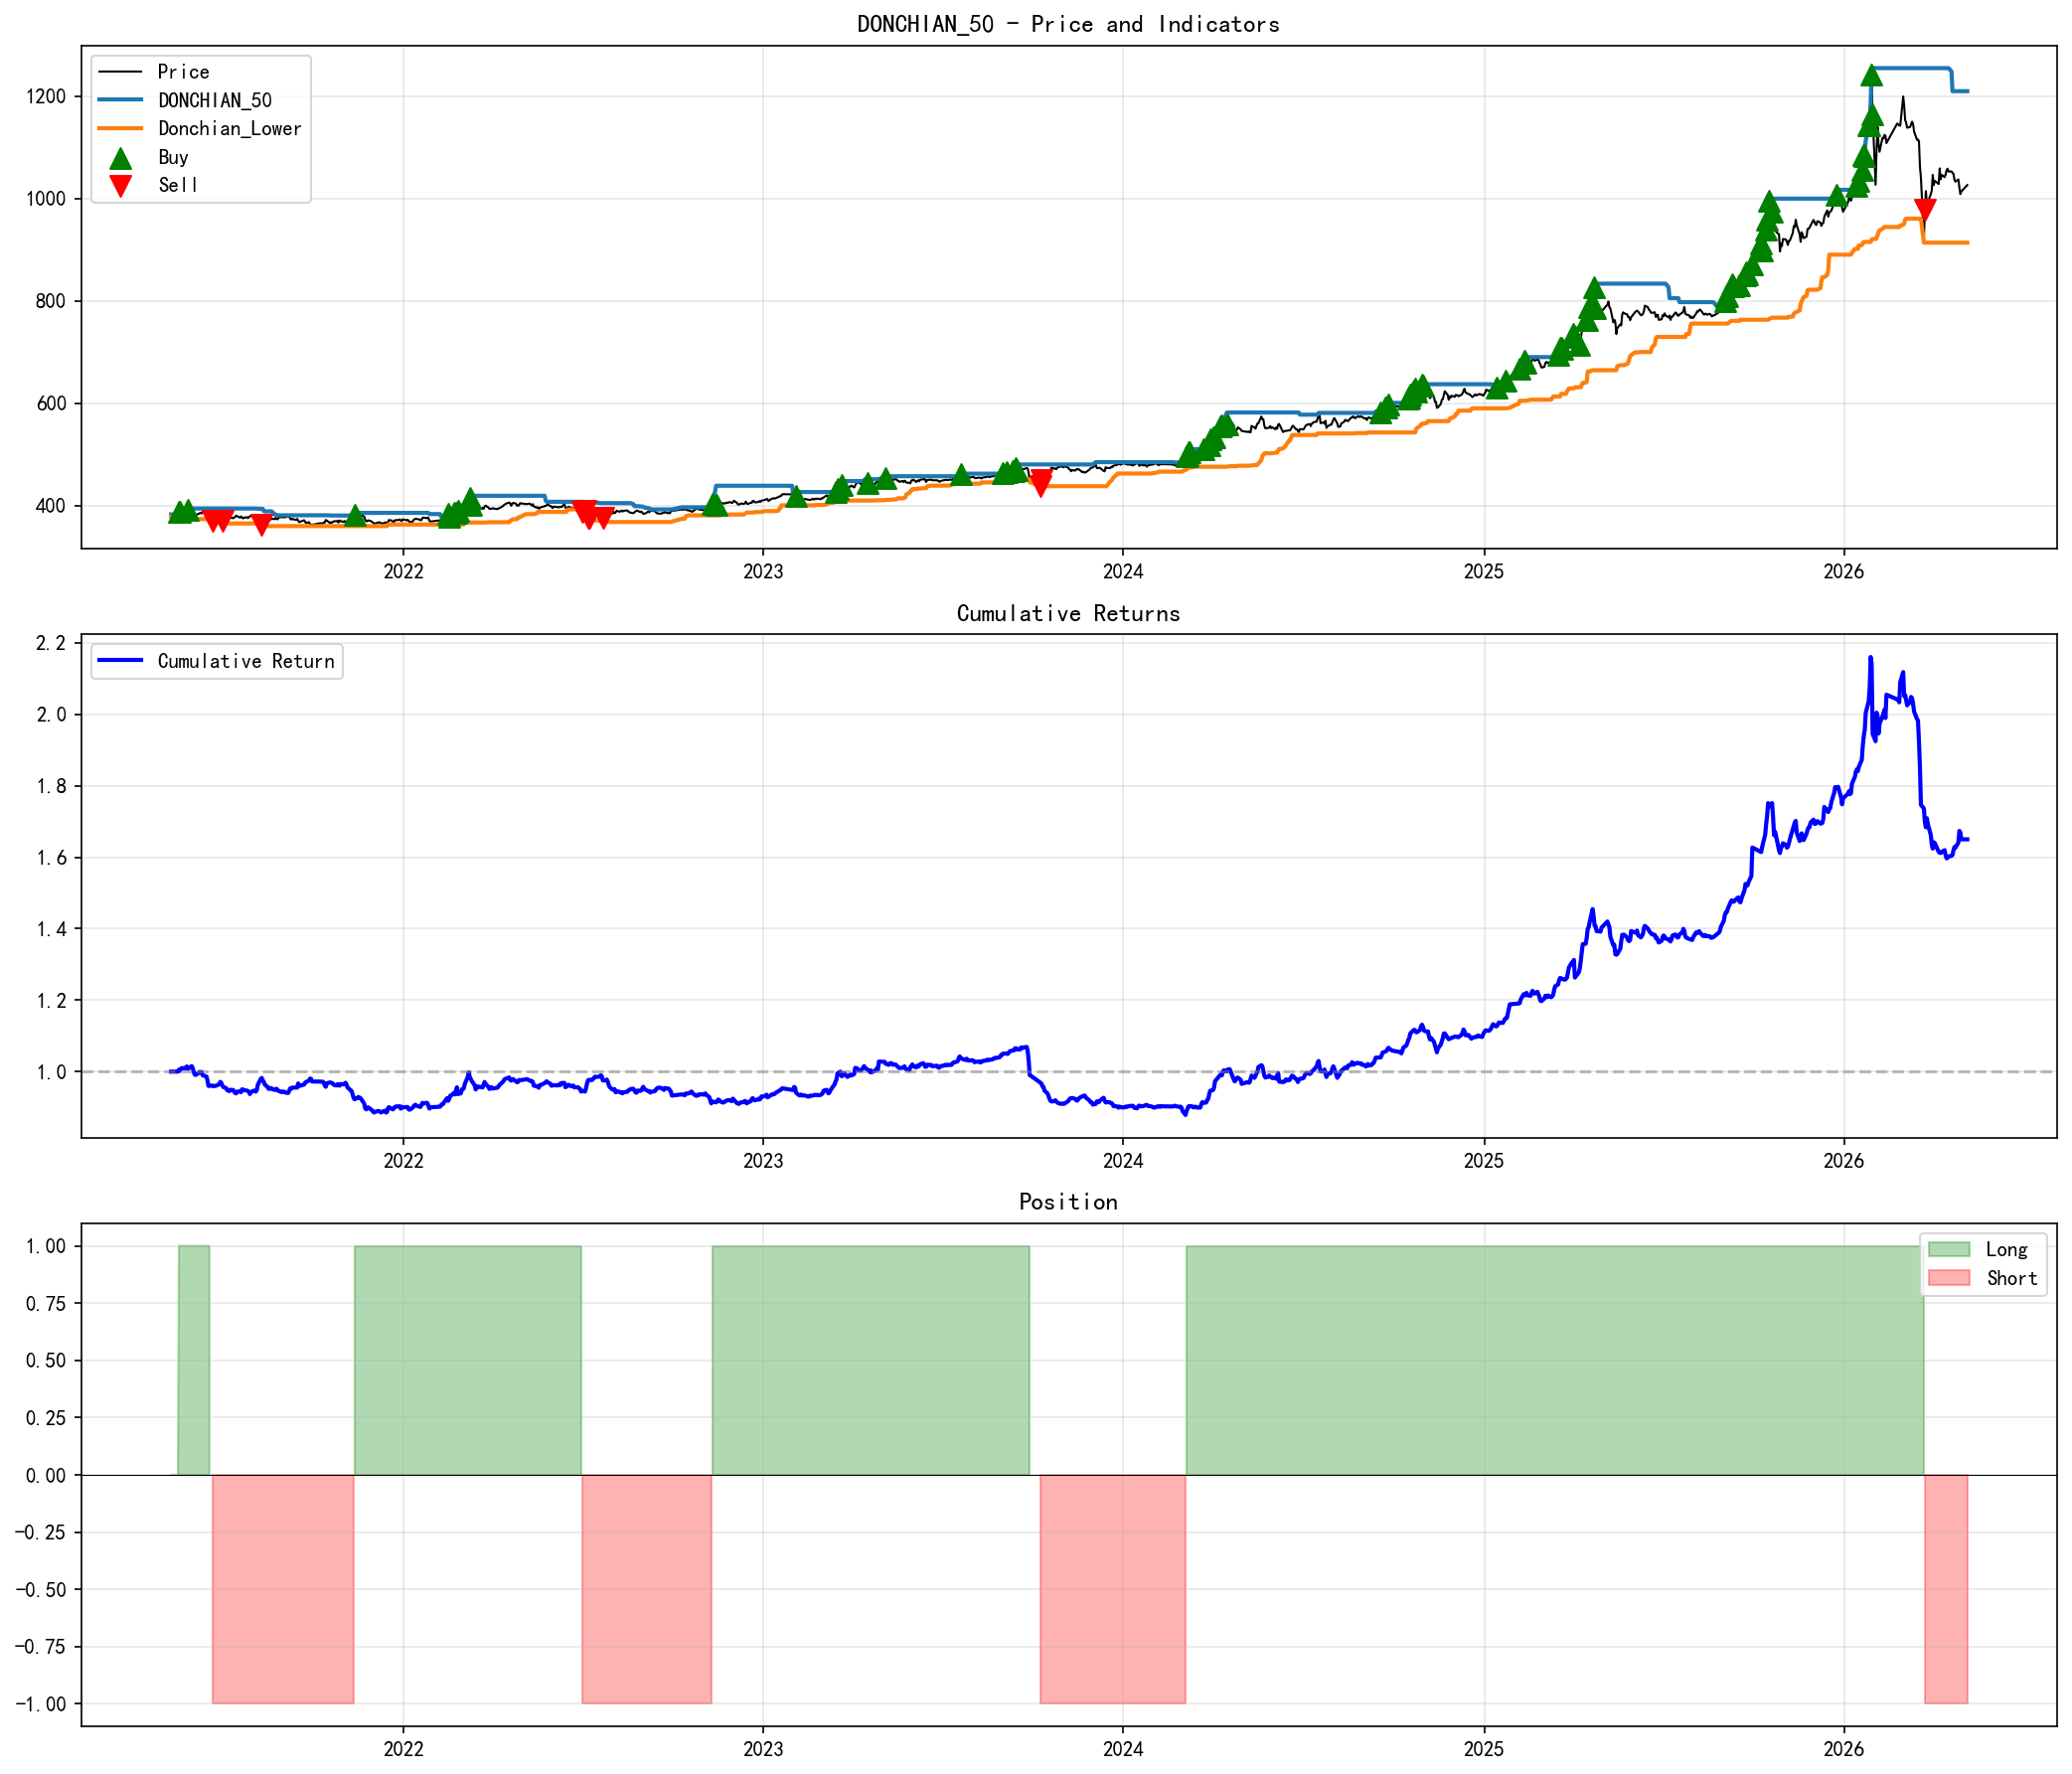
Donchian (50)
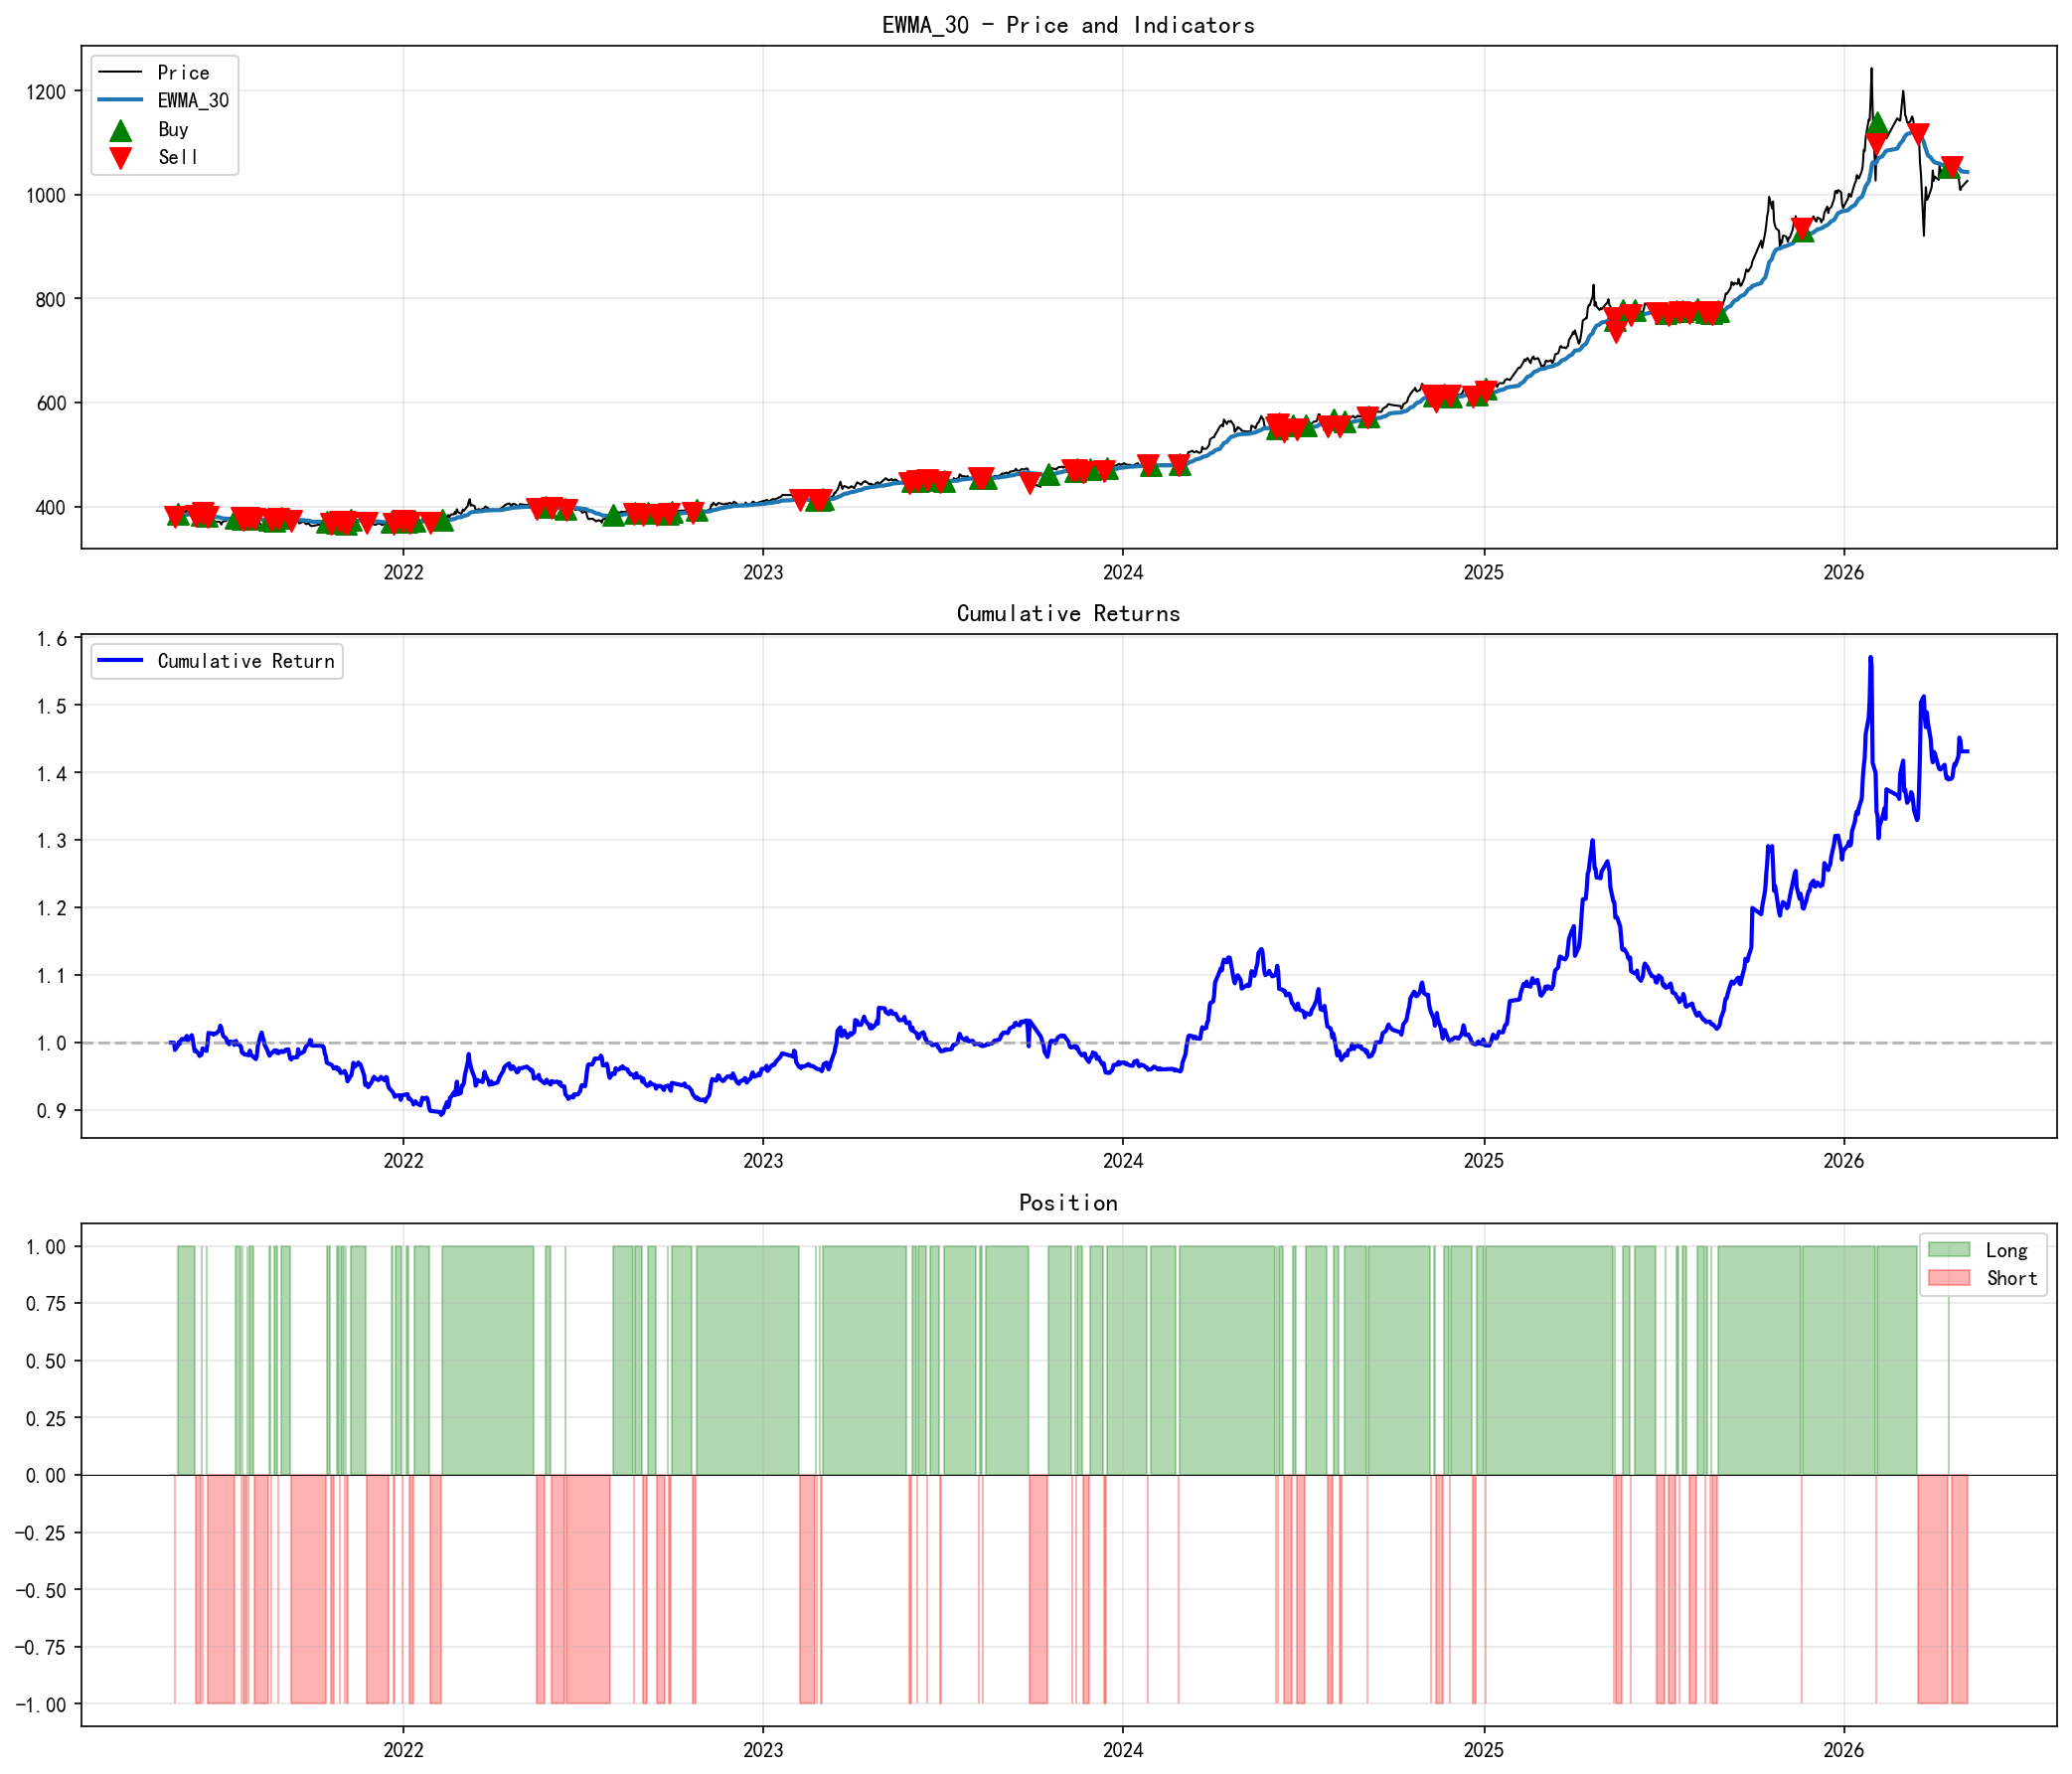
EWMA Long-Short
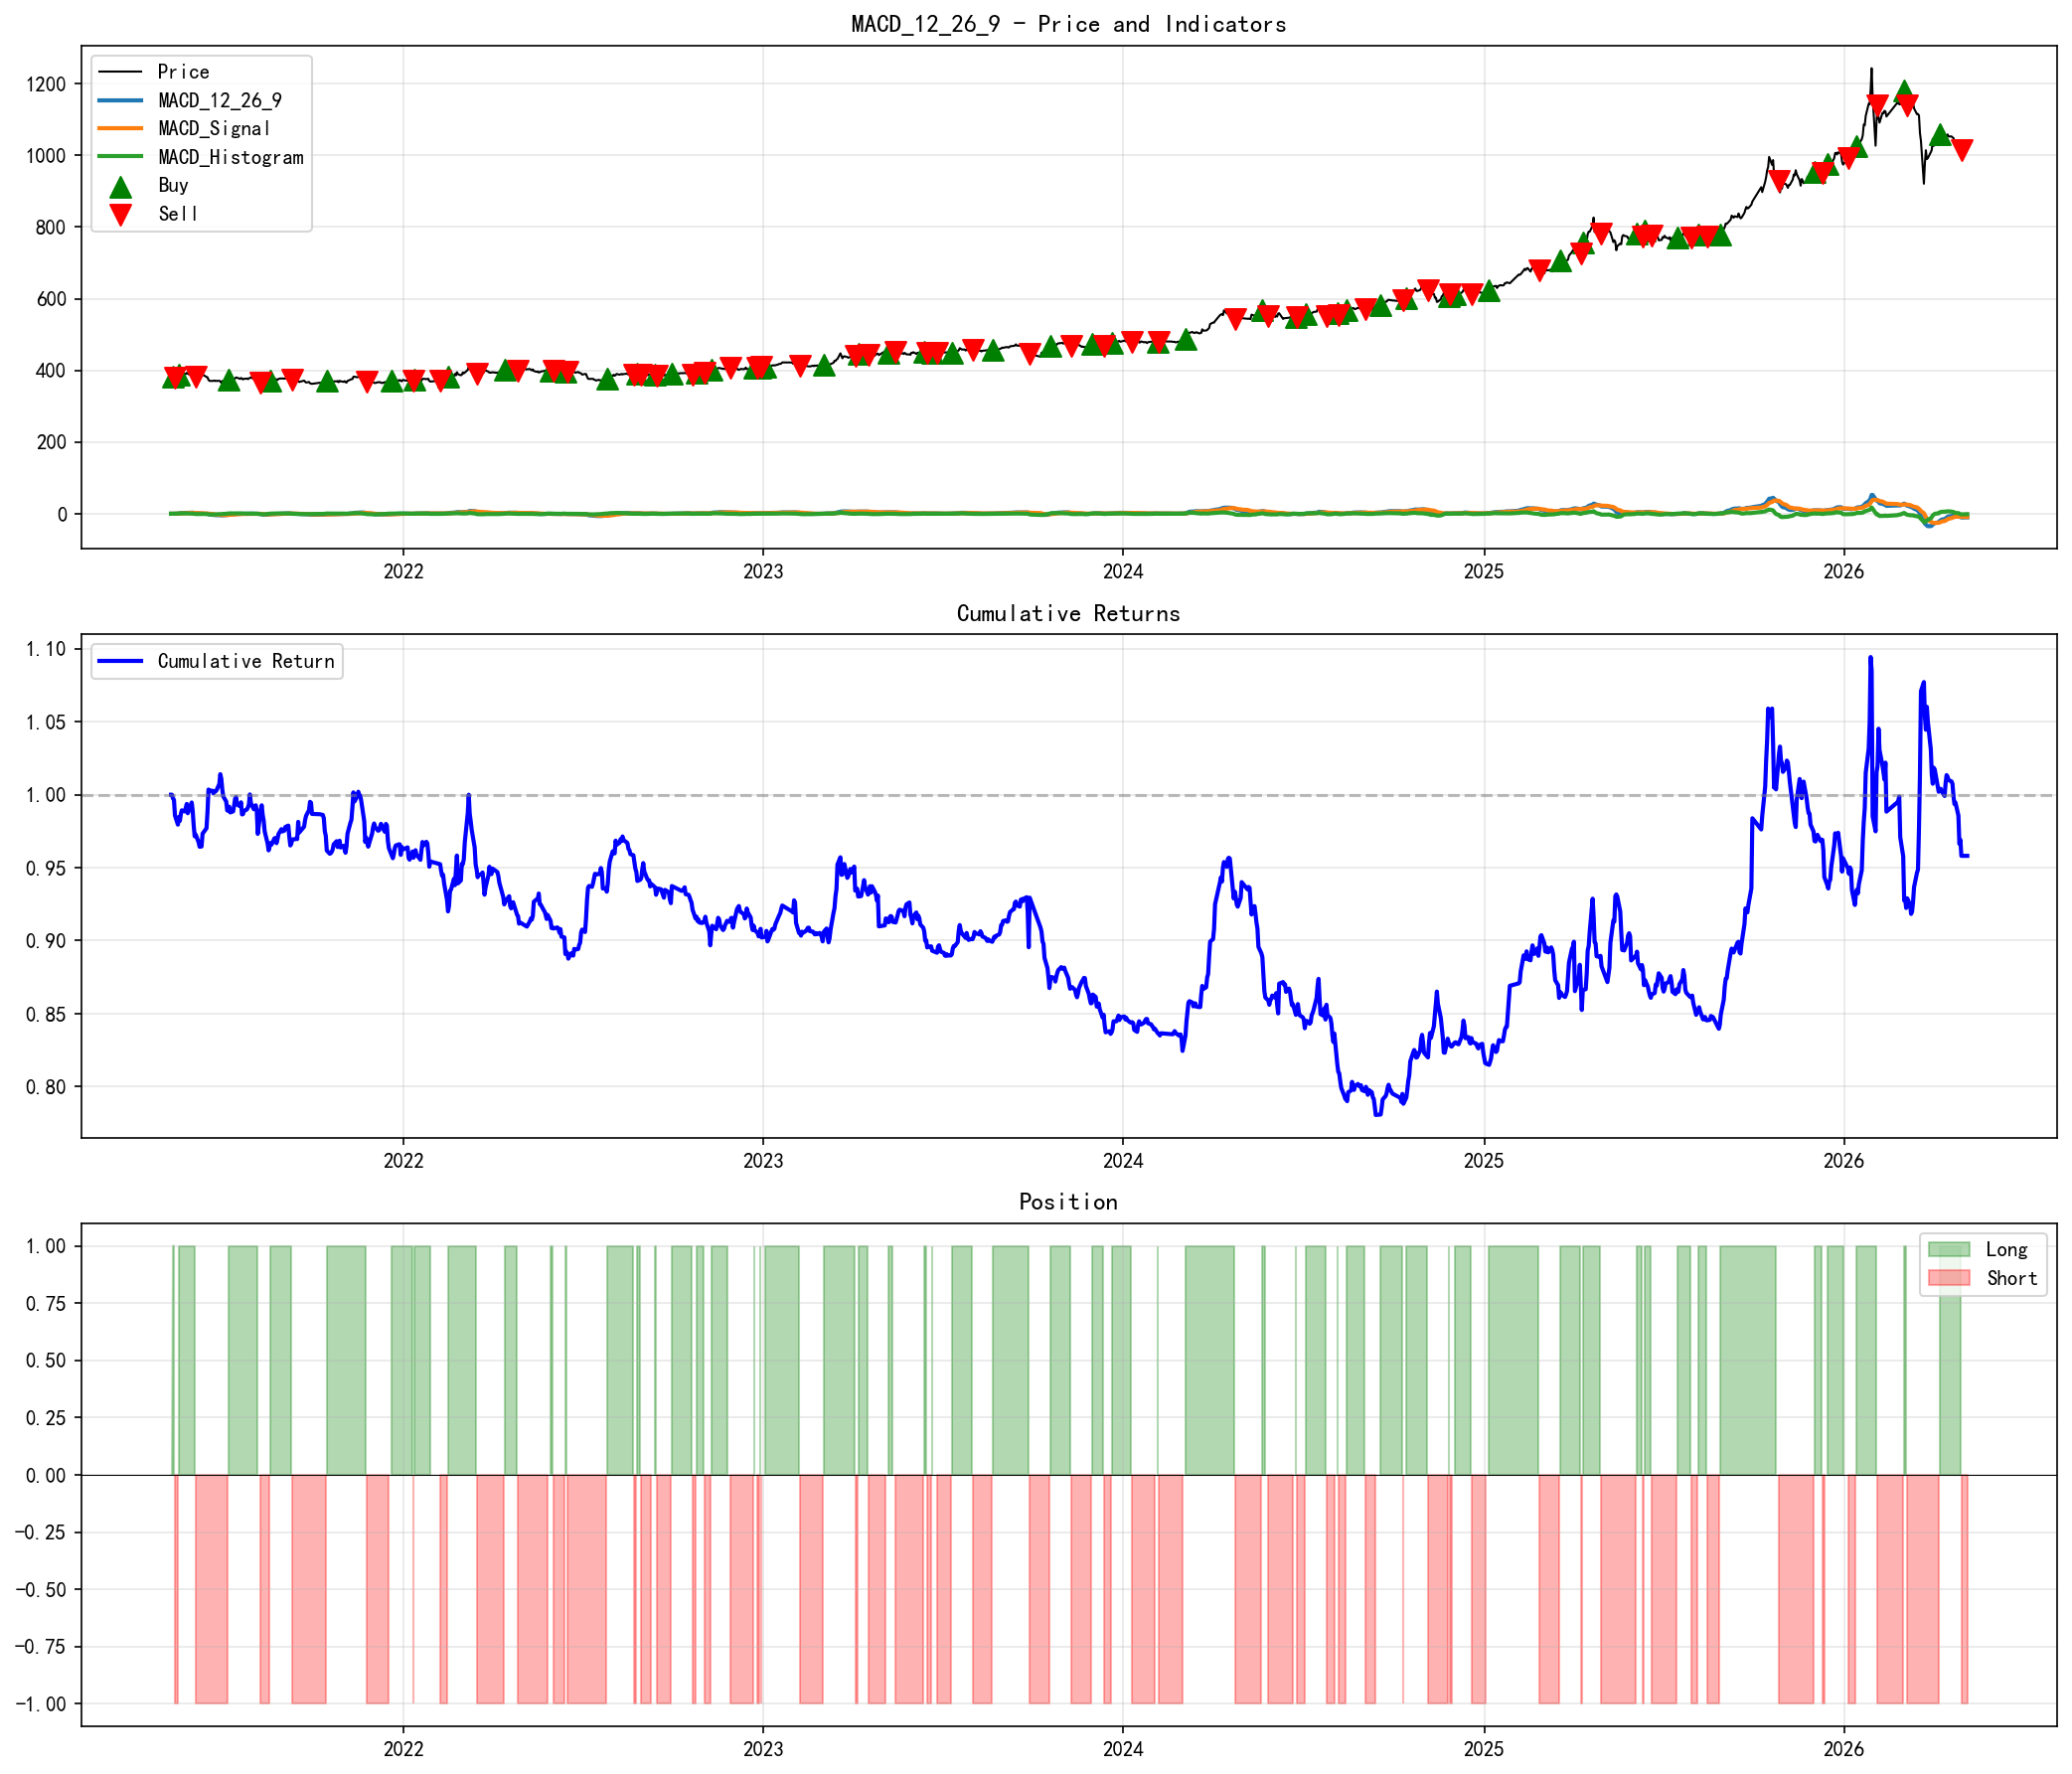
MACD (12/26/9)
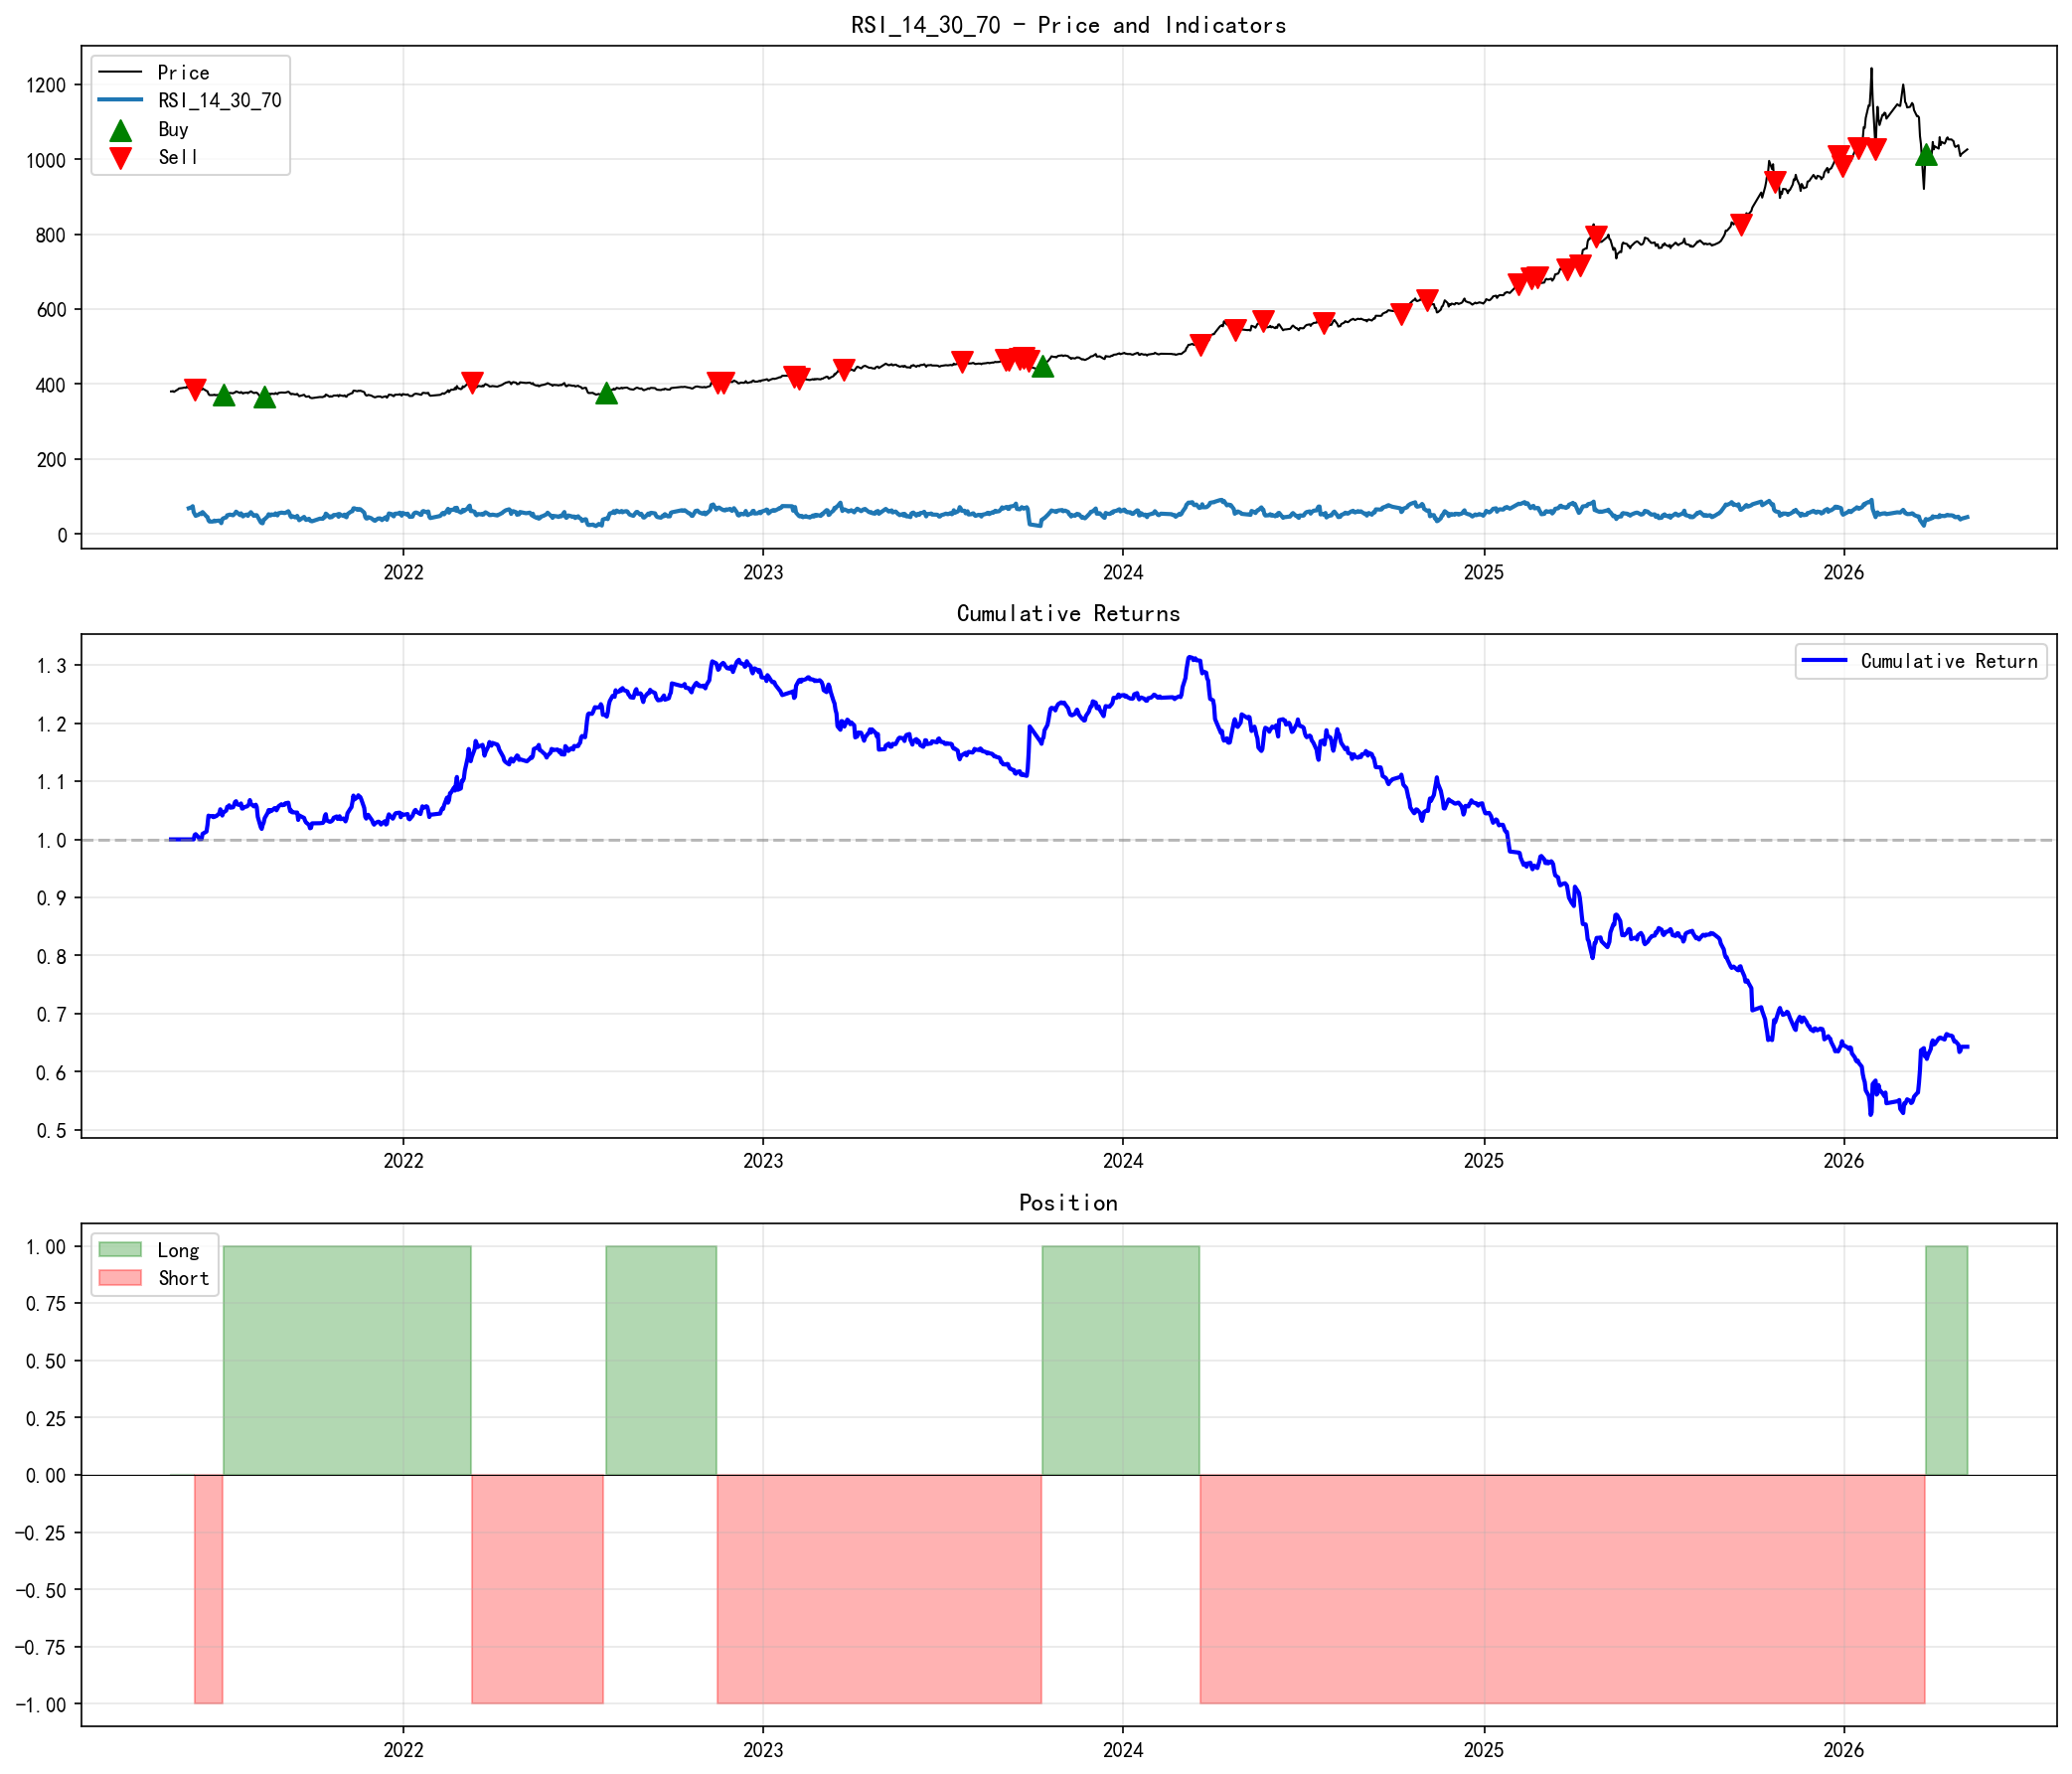
RSI (14, 30/70)
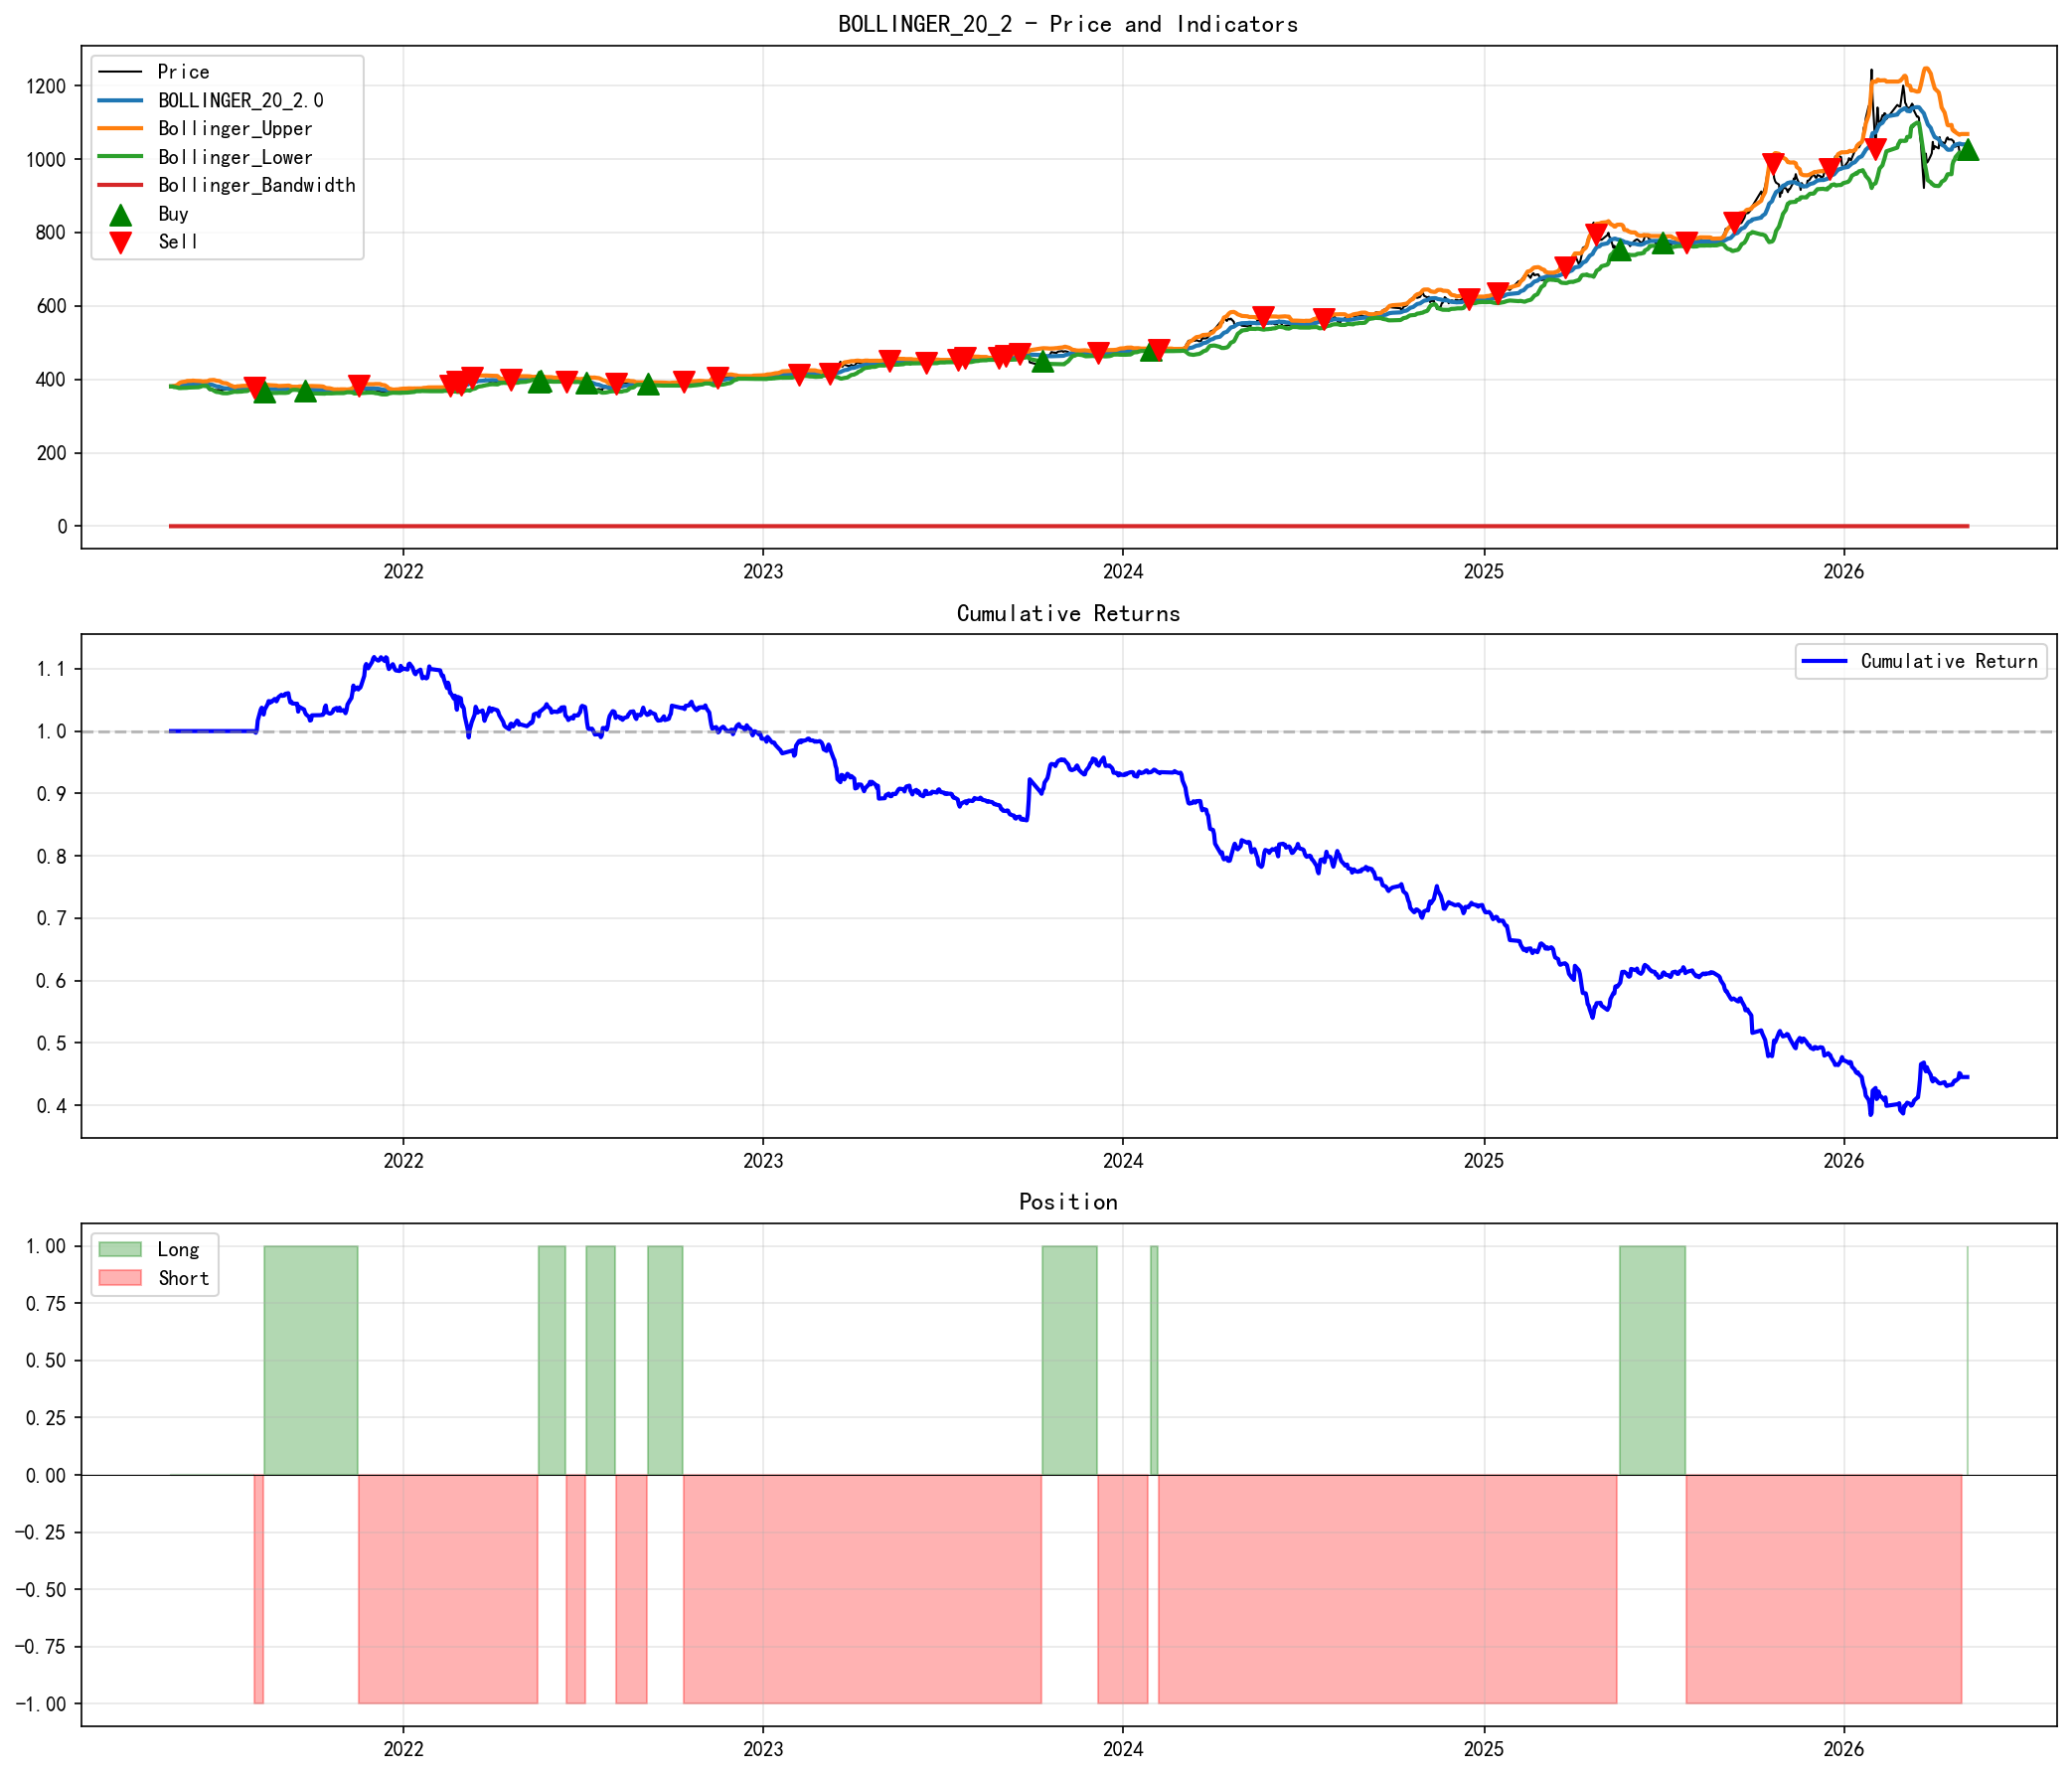
Bollinger (20, 2.0)
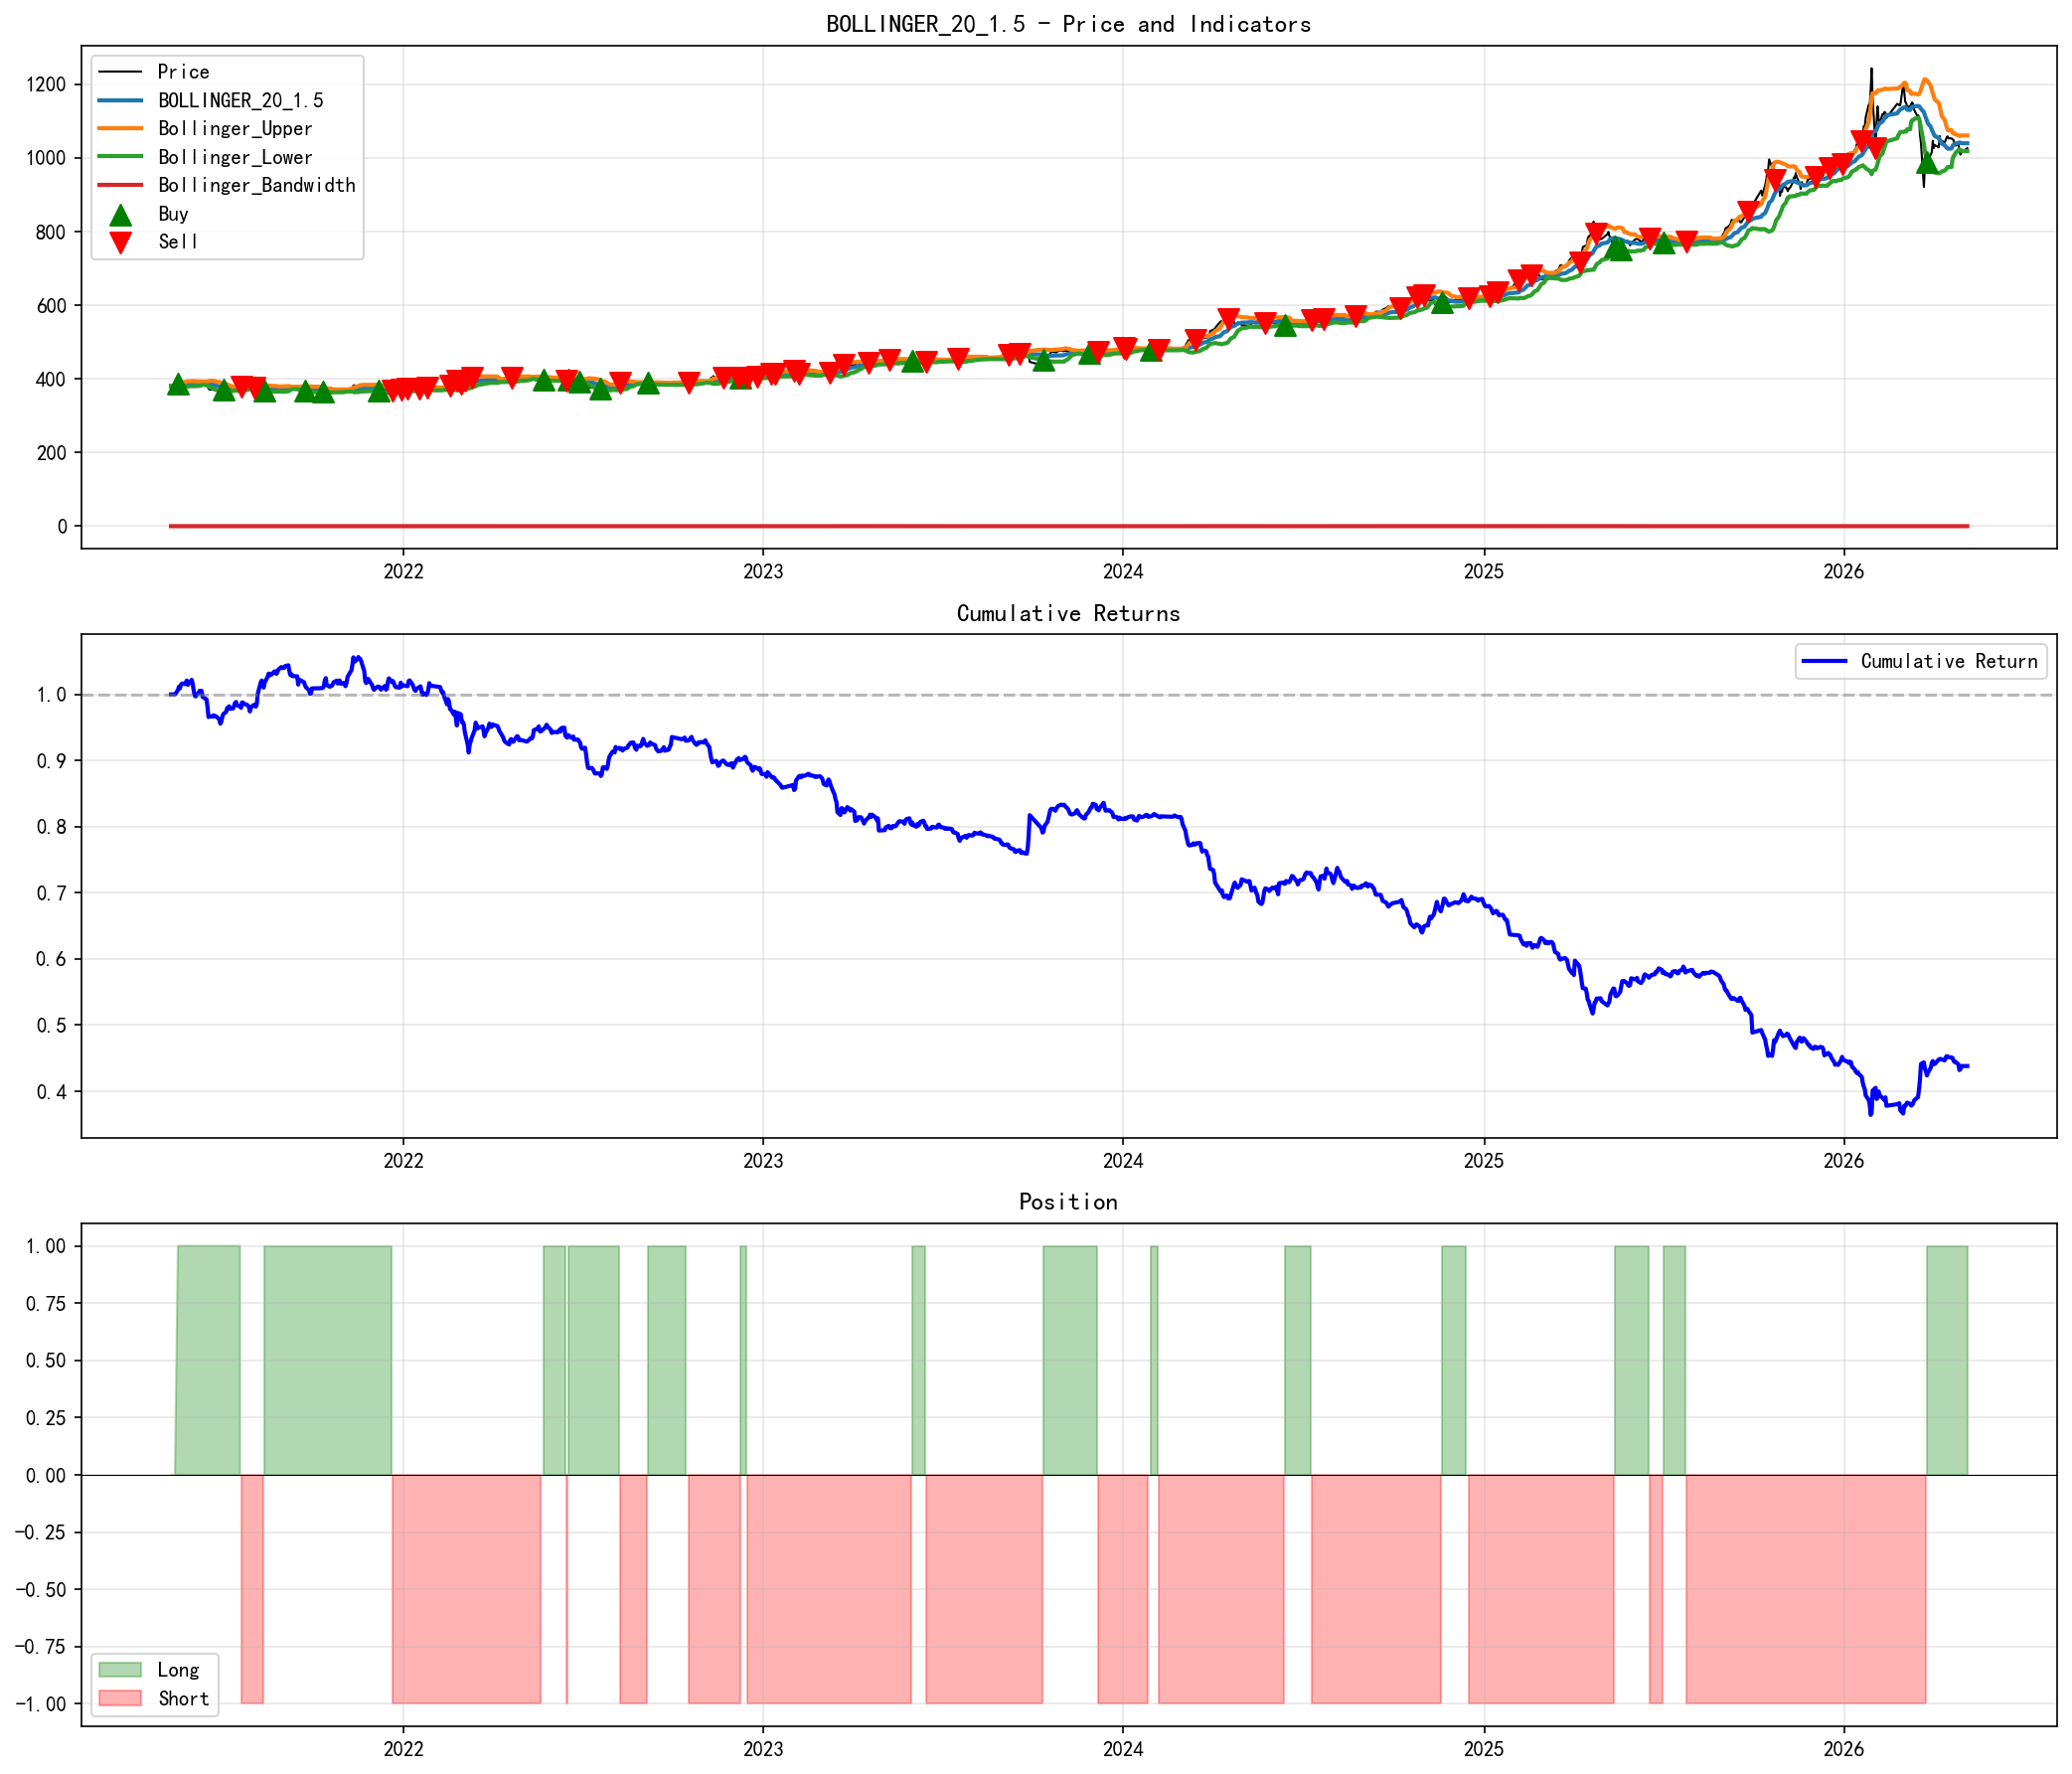
Bollinger (20, 1.5)